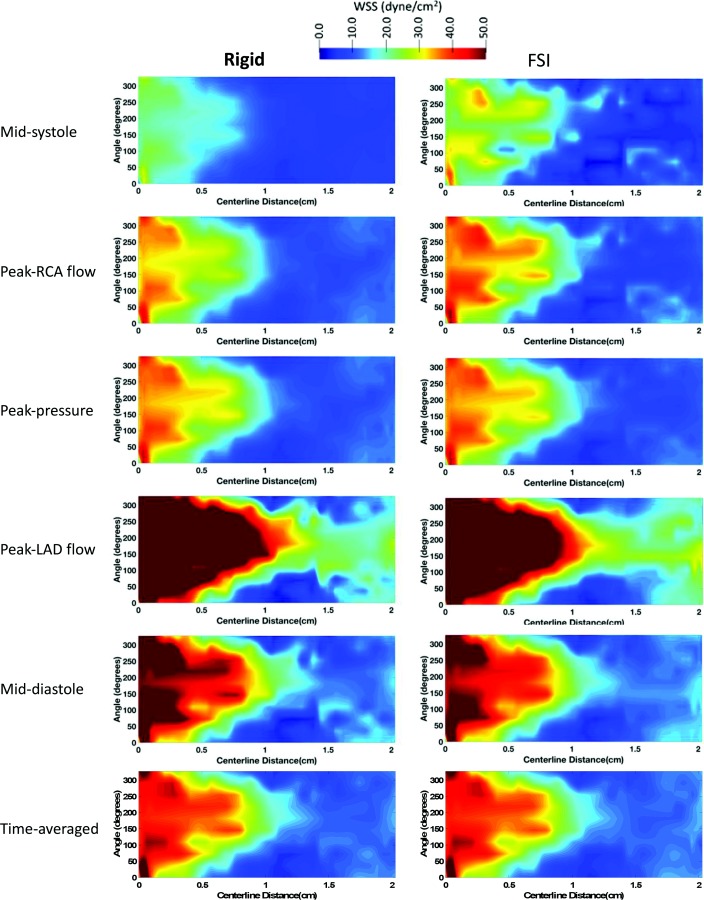
Fig. 5.

2D unwrapped map of WSS in pLAD of a representative case (participant 1) at midsystole, peak RCA flow, peak pressure, peak LAD flow, mid-diastole, and averaged through the last cardiac cycle for the rigid (left column) and FSI (right column) models. Time points along the cardiac are shown in Figs. 2(s)–2(w). LAD: left anterior descending, RCA: right coronary artery.
