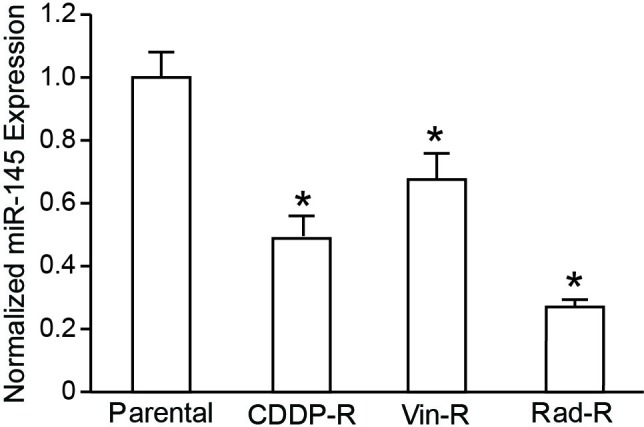
Figure 1. QRT-PCR analysis of miR-145 in CDDP-R, Vin-R, and Rad-R human neuroblastoma cells.

Expression of miR-145 was normalized to expression of miR-145 in parental BE(2)-C cells. Expression levels of miRNA are shown as relative ratios with respect to the SNORD61 expression level and calculated by the 2‐ΔΔC(t) method. Data are the mean ± SEM of three independent RT-PCRs (* P < 0.05 vs. Parental).
