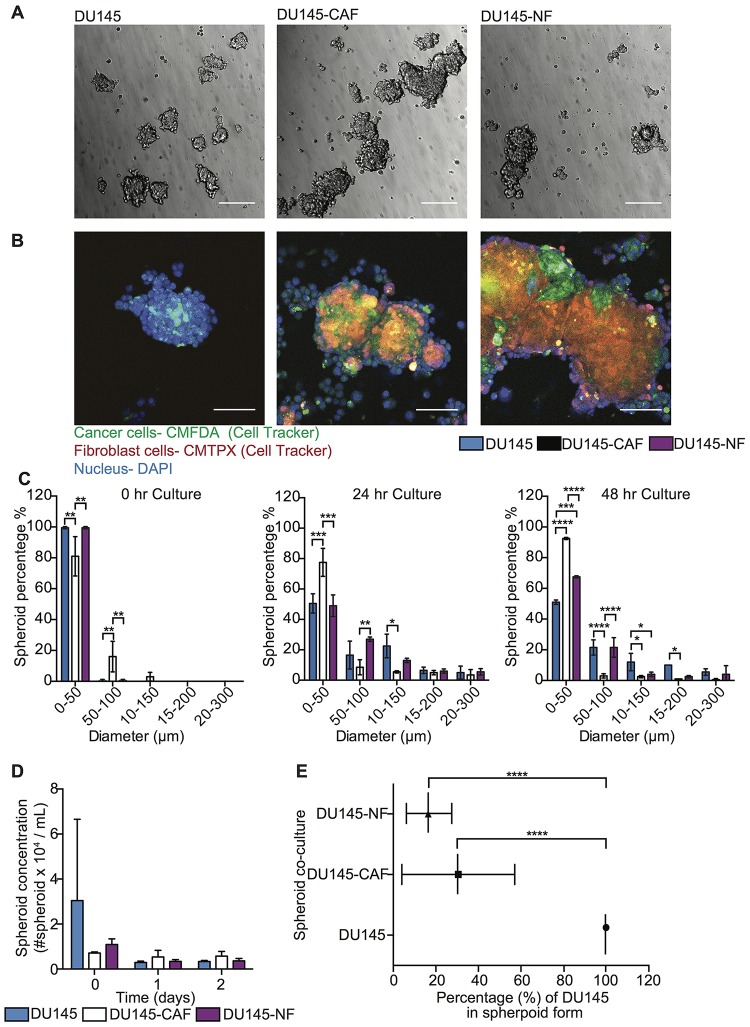
Figure 1. Characterization of DU145 and stromal cell co-culture in spheroid growth and composition.
(A) Bright field images of DU145, DU145-CAF and DU145-NF spheroids after 24 hr in culture. Scale bar represents 200 μm. (B) Immunofluorescent staining of DU145, DU145-CAF and DU145-NF spheroids after 24 hr in culture (DU145 in green, fibroblast in red and nucleus in blue). Scale bar of 100 μm. (C) Bar chart represents the size distribution of DU145, DU145-CAF and DU145-NF spheroids at 0, 24, and 48 hr in culture (mean and range; n = 3 of two co-culture wells). Significance effect of DU145 and stromal cell co-culture (* P < 0.0498, ** P < 0.0067, *** P < 0.0003 and **** P < 0.0001) in the size distribution of spheroids at 0, 24 and 48 hr in culture was calculated using two-way ANOVA. (D) Bar graph represents the spheroid concentration of DU145, DU145-CAF and DU145-NF spheroids at 0, 24 and 48 hr of growth (mean and S. D.; n = 3 of two co-culture wells). Non-significance (P < 0.9997) was calculated using two-way ANOVA. (E) Scatter dot chart represents the composition of cells per spheroid in different co-culture conditions (mean and S. D.; n = 3 of two co-culture wells). Significance (**** P < 0.0001) was calculated via two-way ANOVA.

