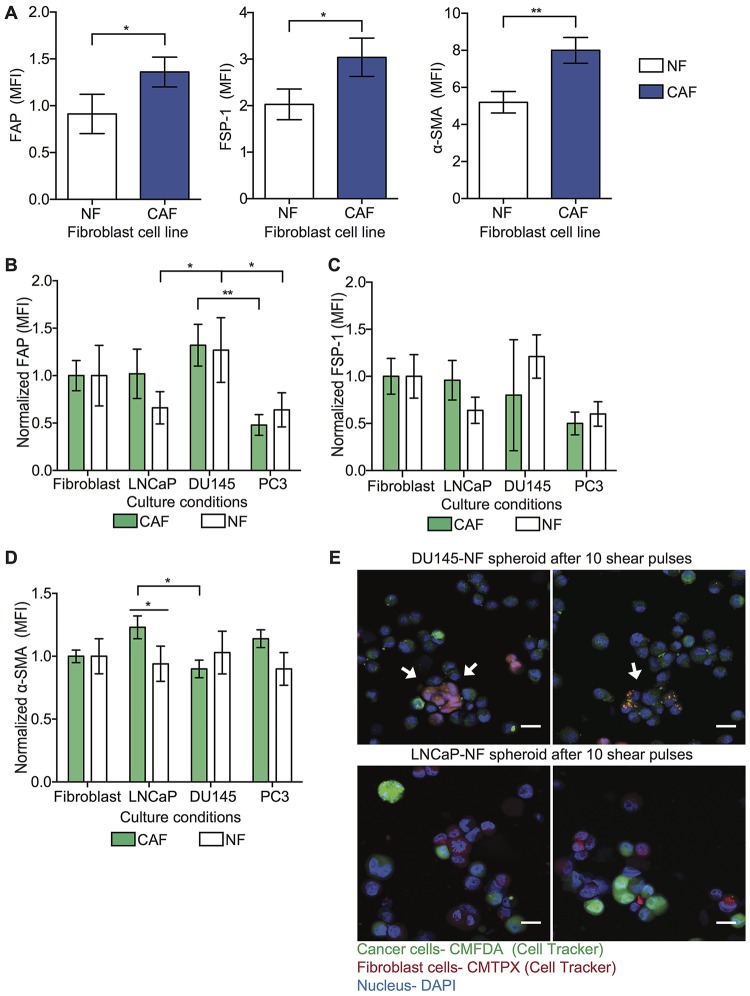
Figure 5. NFs are activated into CAF phenotype.
(A) Bar graph shows the mean fluorescence intensity (MFI) of FAP, FSP-1 and α-SMA expression in NF and CAF cell lines in monoculture conditions (mean and S. D.; n = 3). Significant increase (* P = 0.0419 and ** P < 0.0293) in expression of these biomarkers in CAF compared to NF. (B) Bar graph represents the normalized MFI of FAP expression in NF and CAF co-cultured with cancer cells in spheroid form (mean and S. D.; n = 3). Significance effect of co-culture (* P < 0.0252 and ** P = 0.0022) in FAP expression in NF was calculated using two-way ANOVA. (C) Bar graph represents the normalized MFI of FSP-1 expression in NF and CAF co-culture with cancer cells in spheroid form (mean and S. D.; n = 3). Non-significant fluctuation in FSP-1 expression in NF compared to CAF (P = 0.6727) was estimated by using two-way ANOVA. (D) Bar graph represents the normalized MFI of α-SMA expression in NF and CAF co-culture with cancer cells (LNCaP, DU145 and PC3) in spheroid form (mean and S. D.; n = 3). Significant change in α-SMA expression (* P < 0.0276) was calculated using two-way ANOVA. (E) Immunofluorescence staining of LNCaP-NF and DU145-NF spheroids after being exposed to high magnitude FSS (LNCaP in green, NF marker in red and nucleus in blue). Scale bar is 20 μm.

