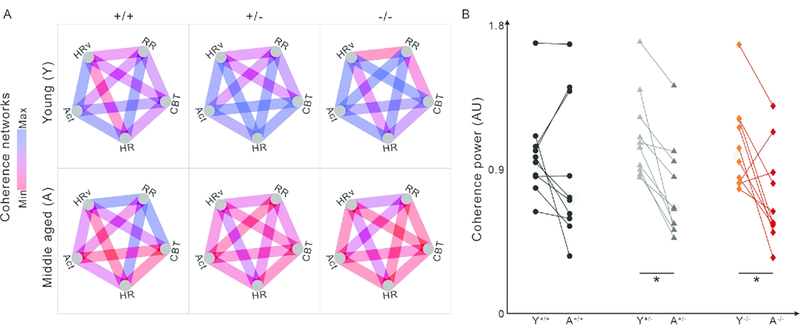
Fig. 9:
Network visualizations allow identification of specific relationships for deeper future explorations, as compared to pan-network group averages. (A) Networks constructed of all possible pairs of circadian coherence of ultradian rhythms between RR, HR, HRV, CBT, and Act allow visual and quantitative assessment of the overall physio-behavioral synchrony within each genotype (from left to right: WT, Het Q175, and Hom Q175). Blue indicates higher relative coherence, red indicates lower relative coherence. (B) Scatter plots compare the average edge strengths across time and genotype (WT: black circle, n=10; Het: grey triangle, n=9; Hom: red diamond, n=8). Edges show significant decreases between young and aged Het and Hom, but not WT networks (*), suggesting they can act as biomarkers for detection of deterioration of network coherence with age in Q175 mice. Data from Cutler et al., 2017.

