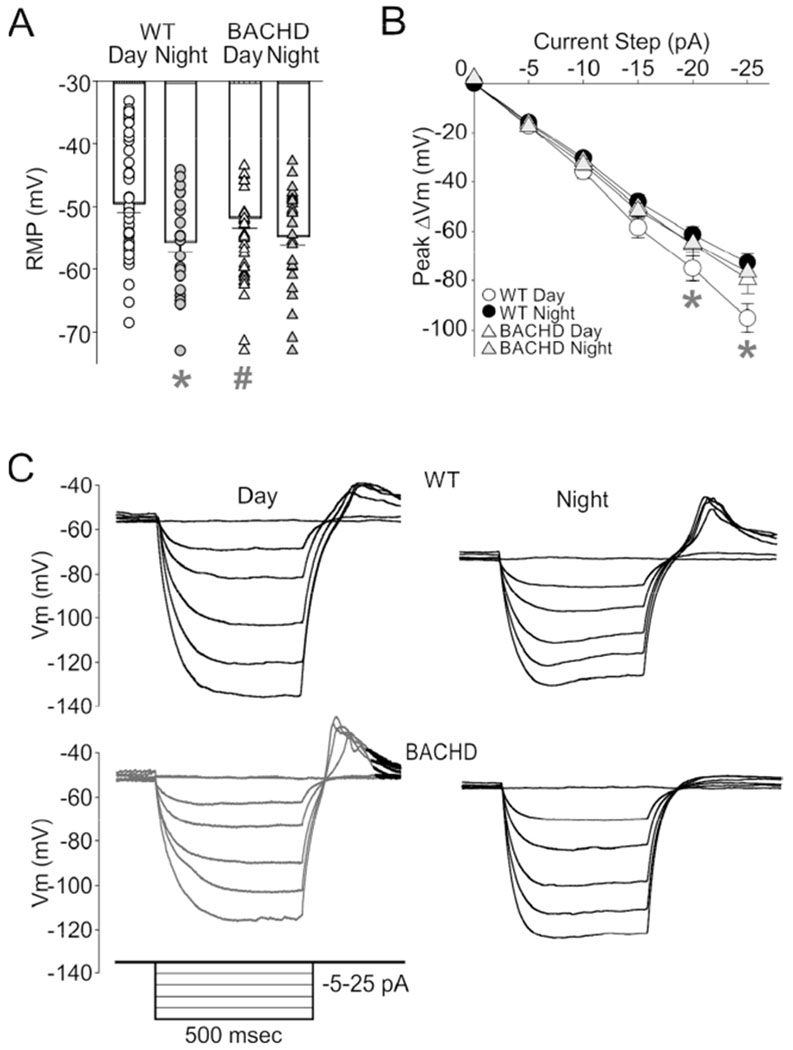
Fig. 2:

BACHD dSCN neurons lose day/night rhythms in resting membrane potential (RMP) and input resistance. (A) Resting Vm of WT (white bars) and BACHD (gray bars) cells recorded in TTX and gabazine. Bar is means ± SEM, individual neuron values overlaid. WT day (white circles, n = 48), WT night (black circles, n = 21), BACHD day (white triangles, n = 33), BACHD night (black triangles, n = 27). (B) Current-voltage response curve for negative current injection steps. WT day (white circles, n = 36), WT night (black circles, n = 26), BACHD day (white triangles, n = 29), and BACHD night (grey triangles, n = 28). (C) Representative trace examples of dSCN neurons responses to negative current injection during the day (left) and night (right). The insert shows the current injection protocol used to evoked the voltage responses. The magnitude of post-inhibitory rebound potentials did not vary between the genotypes. Two-way ANOVA with genotype and time as factors. * = significant difference between day and night; # = significant difference between genotype.
