
Fig. 4:
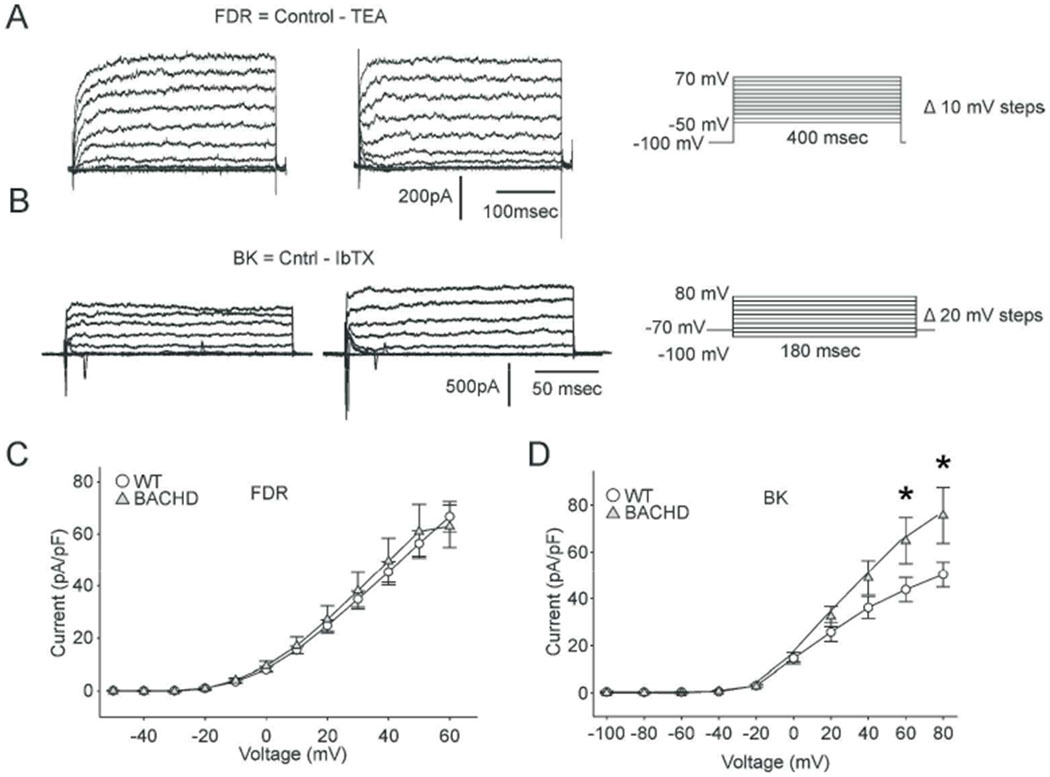
The BK potassium (K+) current is enhanced in BACHD dSCN neurons. (A) FDR, and (B) BK current trace examples recorded from WT (left) and BACHD (right) dSCN neurons during the daytime. Voltage step protocol shown to right. Current-voltage response curve summary for (C) FDR (n = 35), and (D) BK (n = 22) currents measured from WT (circles) and BACHD (grey triangles) neurons. Symbols and error bars represent means ± SEM. Two-way ANOVA was used to identify significant effects of genotype and/or voltage step magnitude on evoked currents (P ± 0.05). * = significant difference between genotypes.