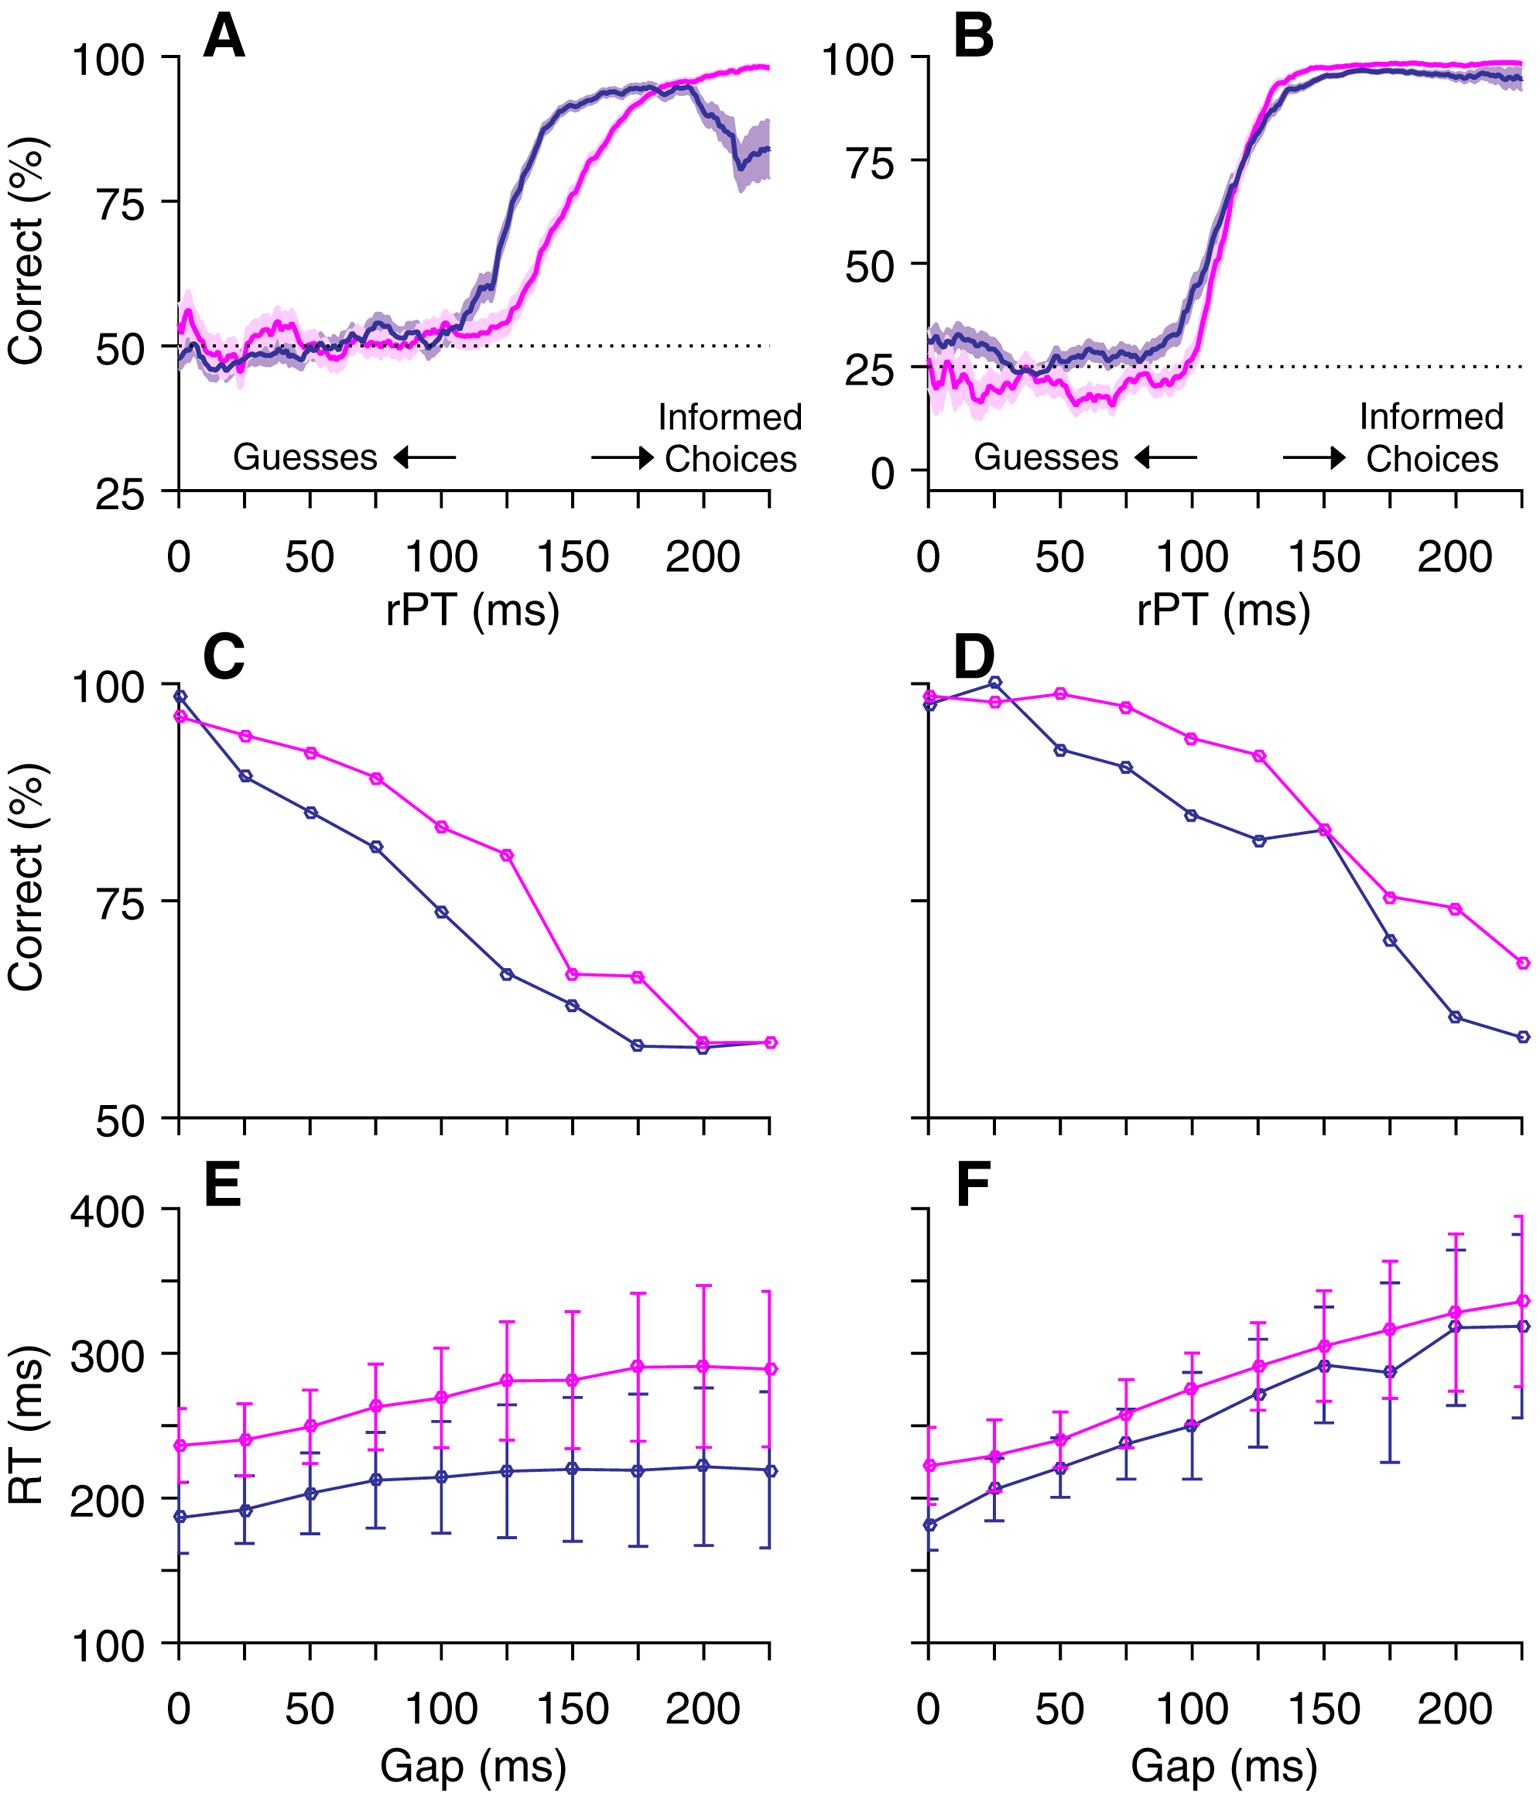
Figure 2.

Behavioral data from two monkeys in the compelled tasks. A, C, E, CS task performance from Monkey R (magenta, 9814 trials) and Monkey I (purple, 10079 trials). B, D, F, CO task performance from Monkey R (magenta, 8671 trials) and Monkey I (purple, 8944 trials). A, B, Percentage of correct responses as a function of rPT (tachometric curves). Shading denotes standard error, dotted lines indicate chance performance, and arrows indicate time points for separation of long- and short-rPT trials. Note differences in y-axes reflecting different chance levels in 2 (CS) and 4 (CO) stimulus tasks. C, D, Percent correct as a function of Gap duration. E, F, RT as a function of Gap duration. Error bars denote standard deviations. Data points include correct and incorrect responses.
