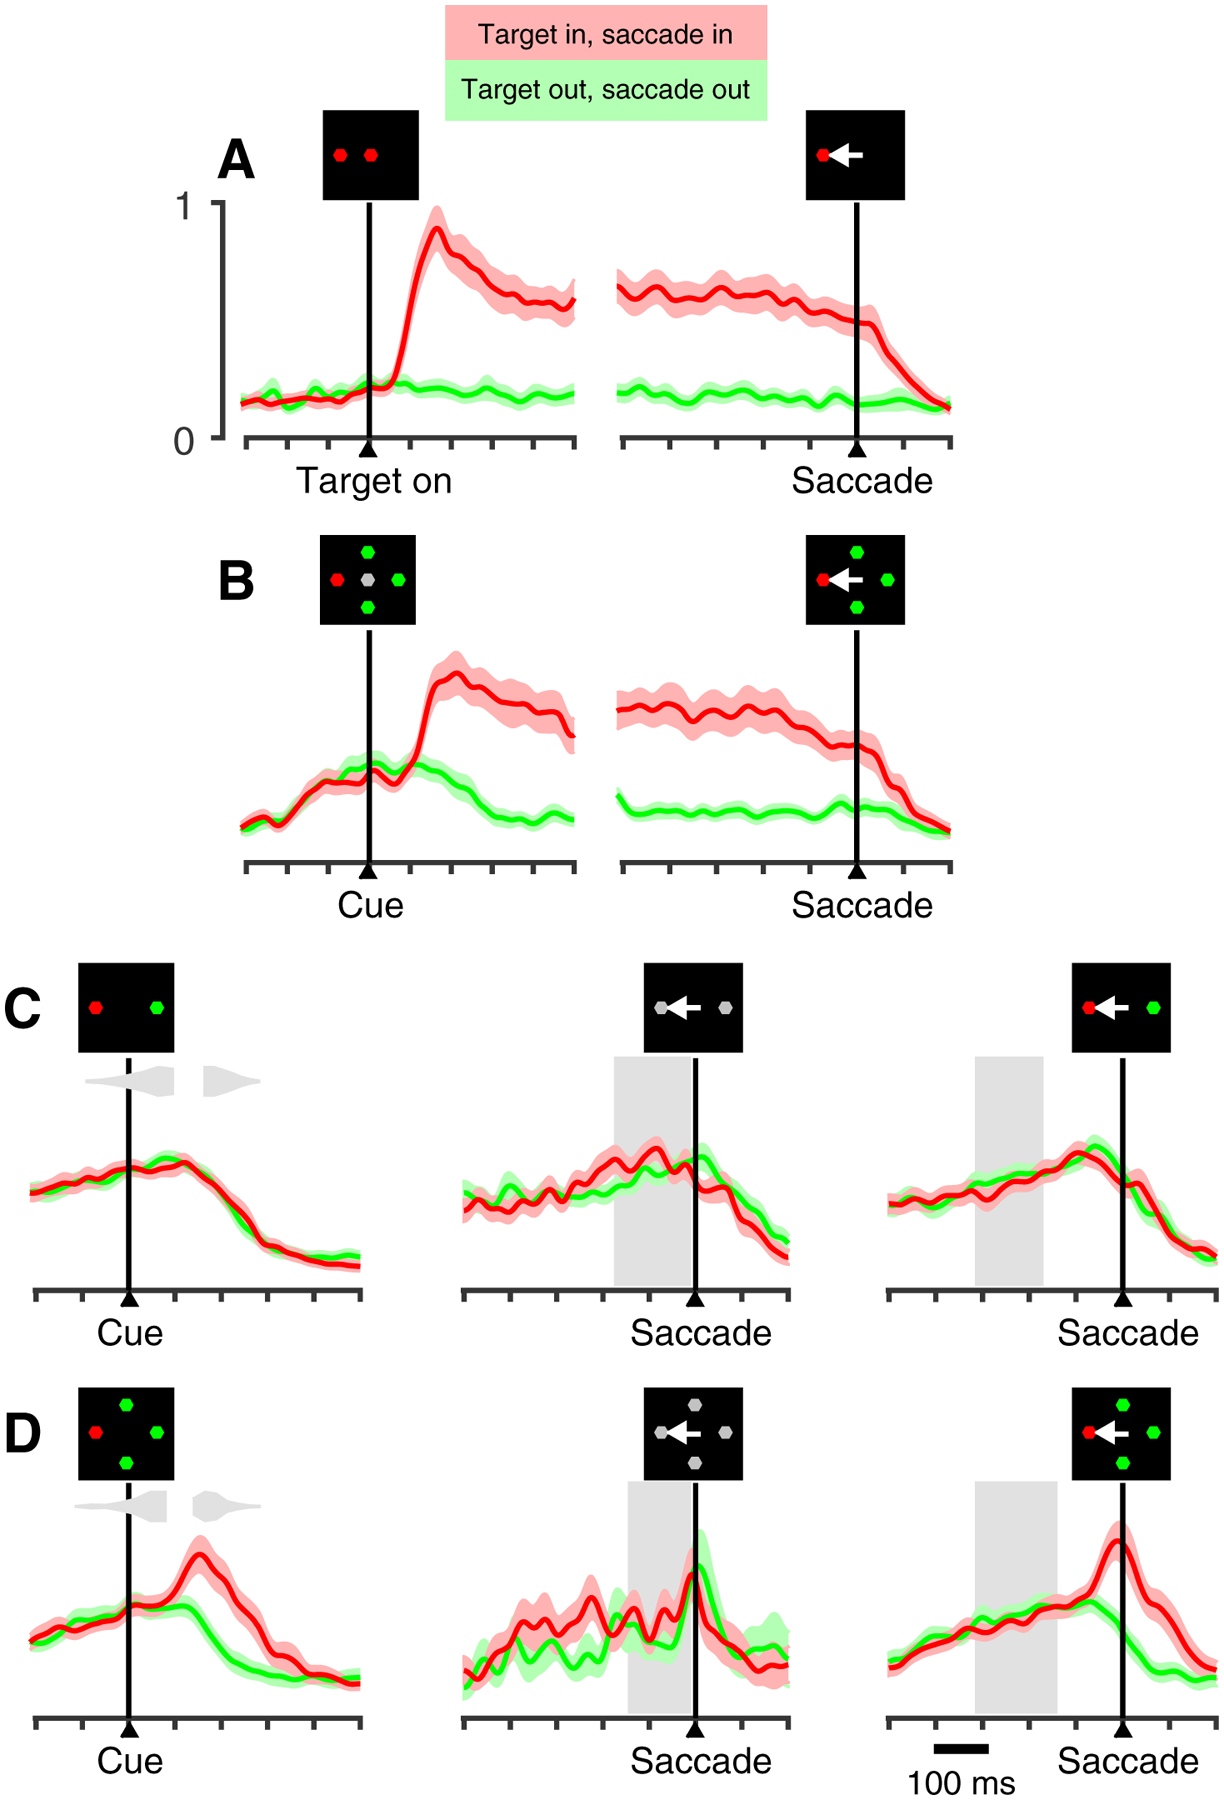
Figure 4.

Population activity from 40 V neurons recorded in all four tasks. Same format as in Figure 3, except that light red and green shades indicate ± 1 SE across cells. Y-axes correspond to mean, normalized firing rate, with equal scale for all plots. A, Delayed-saccade task. B, EO task. For compelled tasks (C-D) data are aligned on cue onset (left) and saccade onset for short (center) and long (right) processing times. Note lack of target/distracter discrimination in the CO task at short rPTs (D, center), but clear discrimination at long rPTs (D, right), when perceptual processing informs the choice. Gray inset histograms (C, D; right) illustrate distributions of saccade onset times corresponding to rPT < 110 and rPT > 155 ms (C; CS task) and rPT < 95 ms and rPT > 130 ms (D; CO task).
