Figure 5.

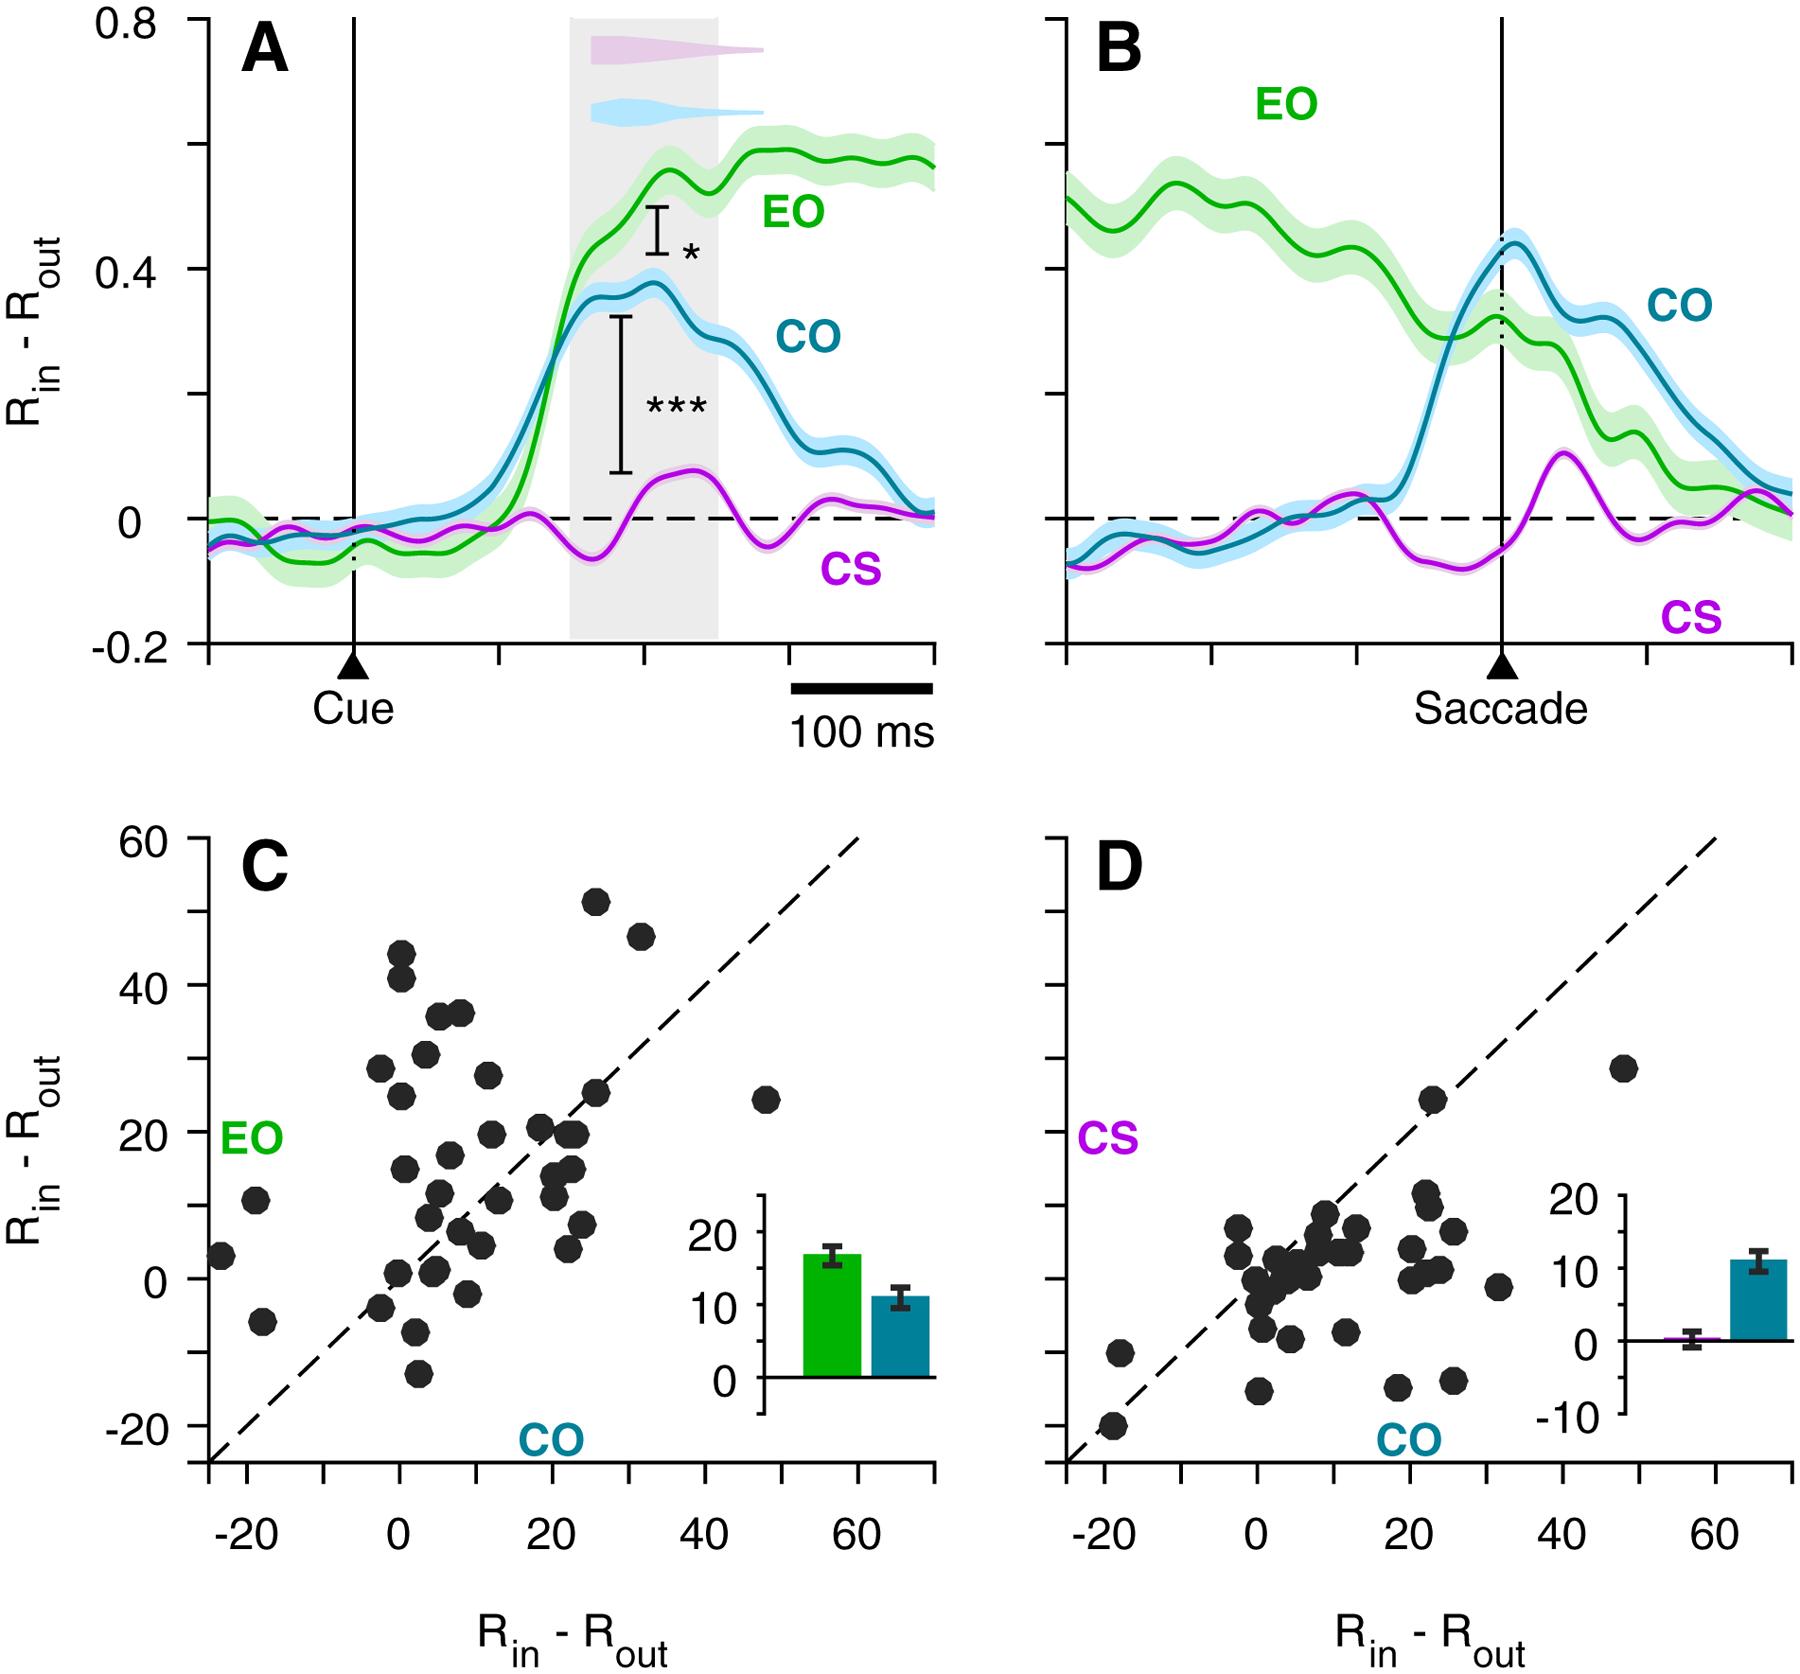
V cell target discrimination as a function of time and task type. Continuous traces (A, B) show difference in normalized activity of V cells (n = 40), RIN – ROUT, as a function of time, where RIN corresponds to target-in/saccade-in choices and ROUT corresponds to target-out/saccade-out choices, all informed (CS task, rPT > 155 ms; CO task, rPT > 130 ms). Data are aligned on cue (A) and saccade (B) for the EO, CO, and CS tasks. Color-coordinated inset histograms (A, top) indicate time of saccade onset for compelled tasks. Scatterplots (C-D) show average firing rate for each cell (scatter dots) taken at the time window indicated by the gray shading (A) for EO and CO tasks (C), and CS and CO tasks (D). Inset bars and error lines indicate mean ± SE across all V cells.
