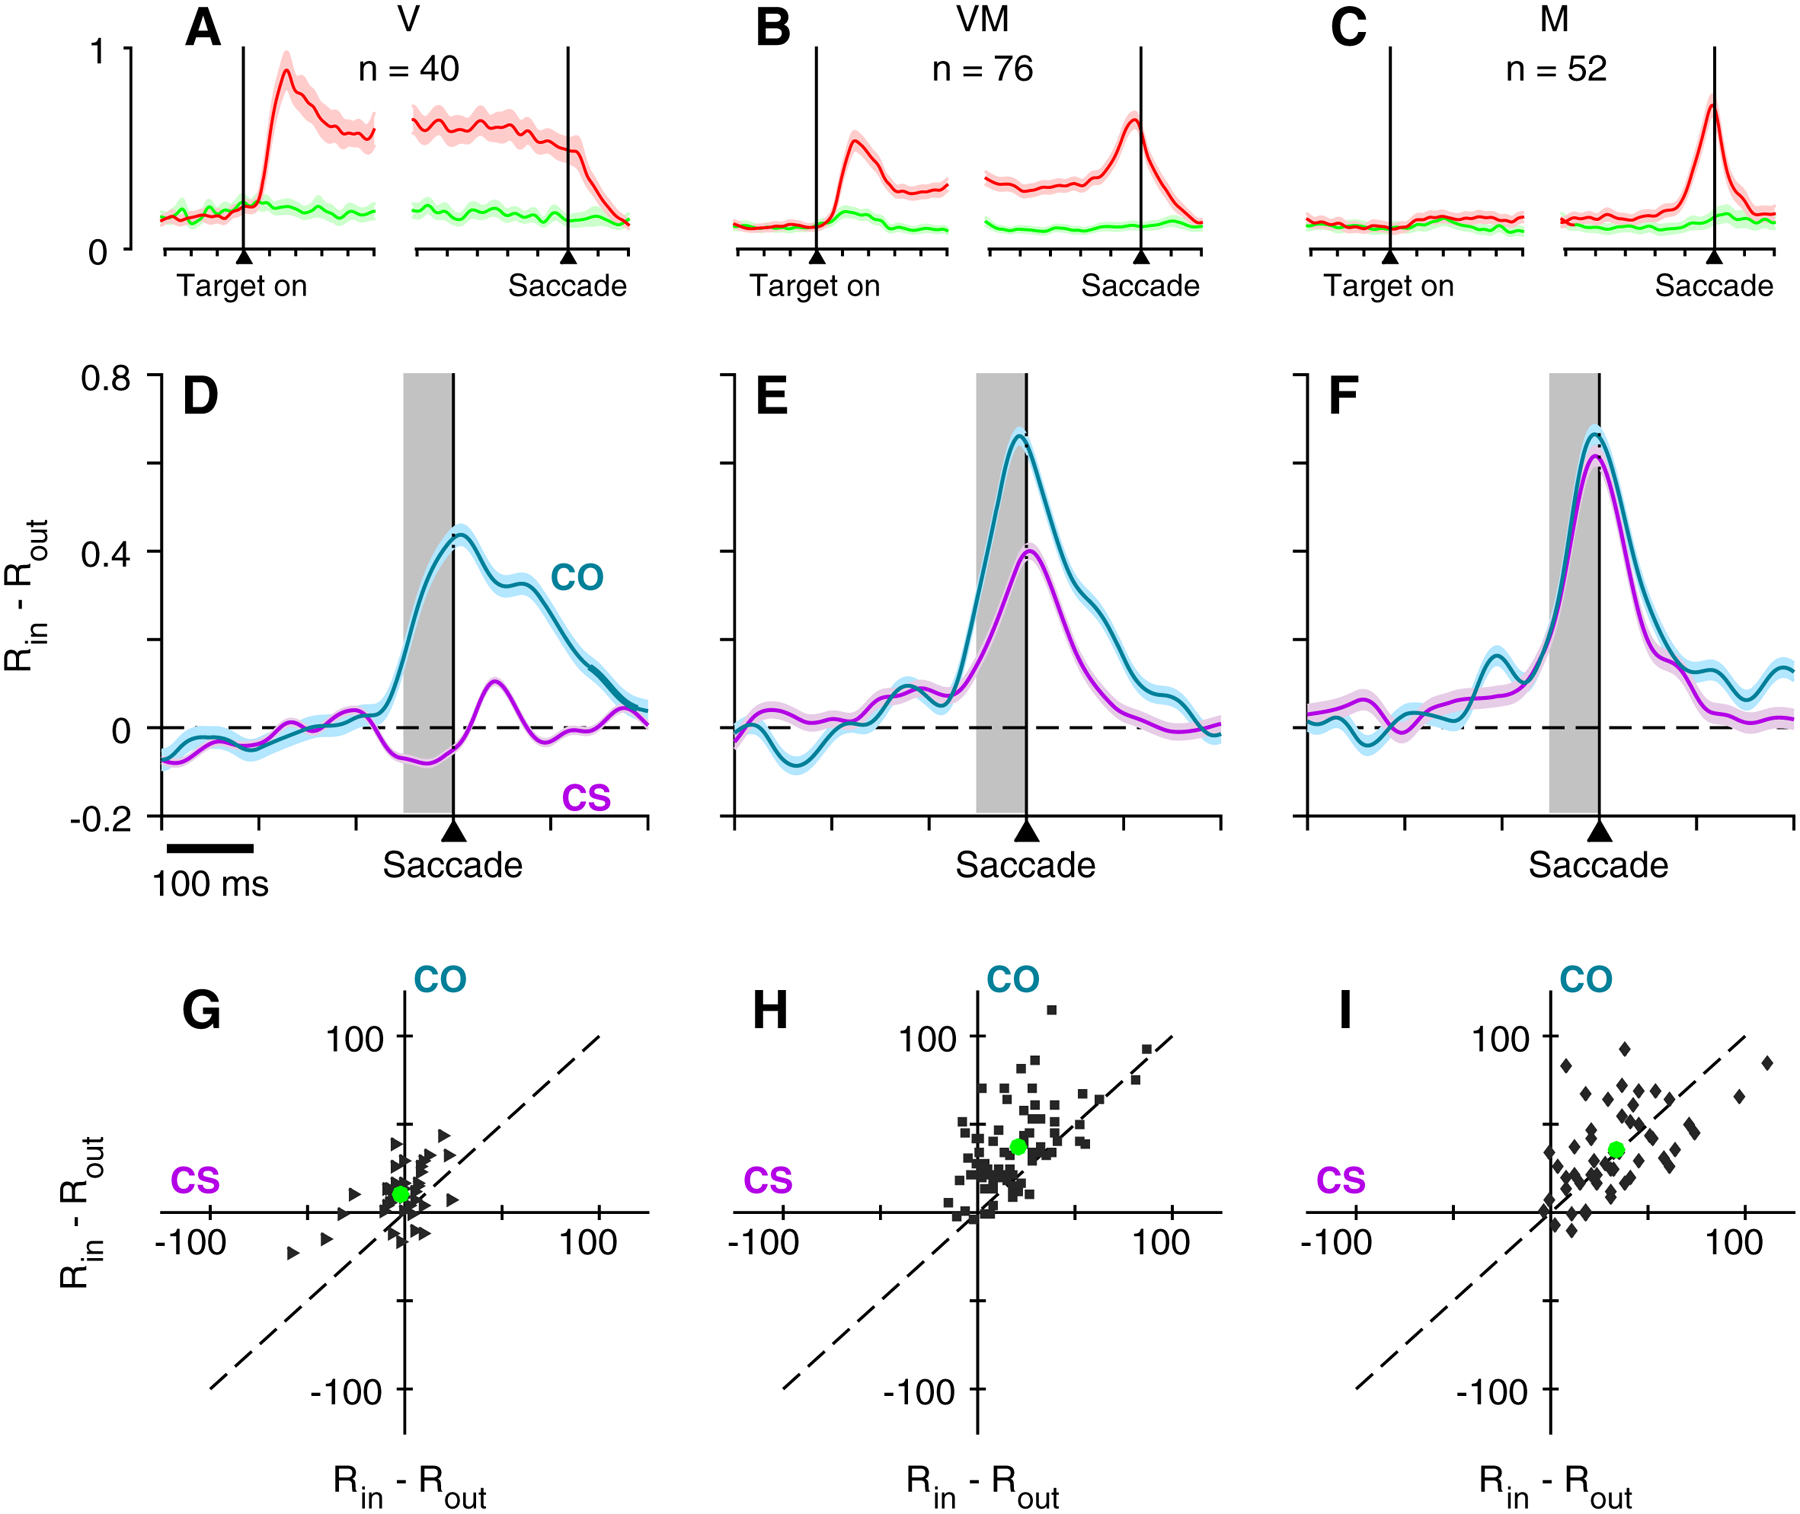
Figure 7.

Urgent target discrimination as a function of time, task, and cell type. Continuous normalized firing rate traces (A-C) show activity in the delayed-saccade task aligned on both Cue and Saccade for V (A), VM (B), and M (C) cells. Colors indicate activity elicited by the target inside (red) or outside (green) of the RF. Blue and purple traces (D-F) show difference in normalized activity (RIN – ROUT) for V cells (D), VM cells (E), and M cells (F) as a function of time, where RIN corresponds to target-in/saccade-in choices and ROUT corresponds to target-out/saccade-out choices, all informed (CS task, rPT > 155 ms; CO task, rPT > 130 ms). Data are aligned on saccade. Scatterplots (G-I) show average firing rate difference for each cell taken at the time window indicated by the gray shading in D-F, for the CS task (abscissa) and the CO task (ordinate). Green circles indicate the population mean for each task.
