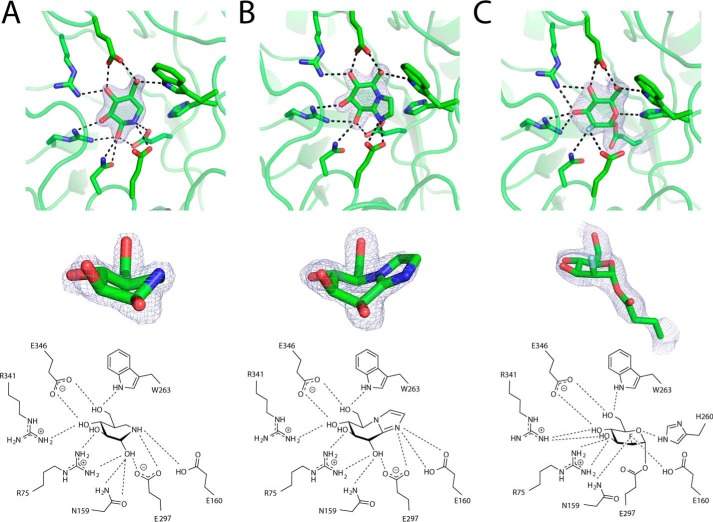
Figure 6.
Complexes of Bs164 with inhibitors. A, complex with noeuromycin; B, complex with mannoimidazole; and C, a complex with covalently bound 2-deoxy-2-fluoromannose. The top panel shows the inhibitor within the active site with polar interactions within 3.2 Å shown as black dashed lines. The middle panel shows the inhibitor with the surrounding electron density, and the bottom panel shows a cartoon schematic of active site interactions. All electron density meshes are σA-weighted 2Fo − Fc densities contoured at 1.5 σ and rendered with the program PyMol. Trp-336, which sits below the inhibitors, has been omitted for clarity.

