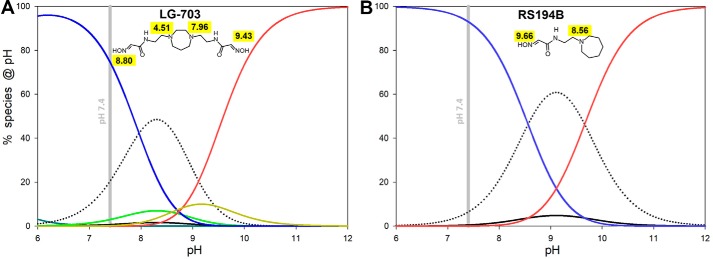
Figure 4.
Calculated pH-dependent abundance of ionization species for selected (8 of 16) species of LG-703 (A) compared with all four ionization species of RS194B (B). Curves were calculated using pKa values from Table 2 and equations given in Figs. S3 and S4. Dotted, uncharged; blue, cationic; red, anionic (for LG-703, it is anionic−2); black, zwitterionic (for LG-703, it is zwitterionic 1). Species found only for LG-703 are zwitterionic 2 (light green) and anionic−1 (orange).

