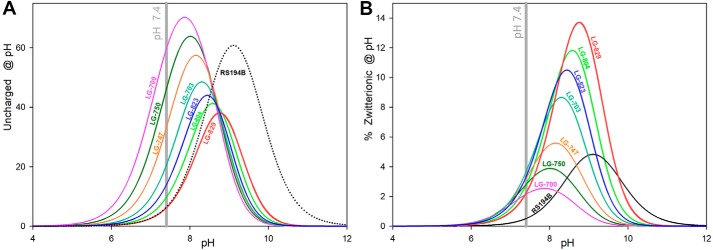
Figure 5.
pH-dependent abundance of ionization species for LG bis-oximes compared with RS194B. A, uncharged oxime species; B, zwitterionic oxime species. Curves were calculated using pKa values from Table 2 and equations given in the supporting materials.

