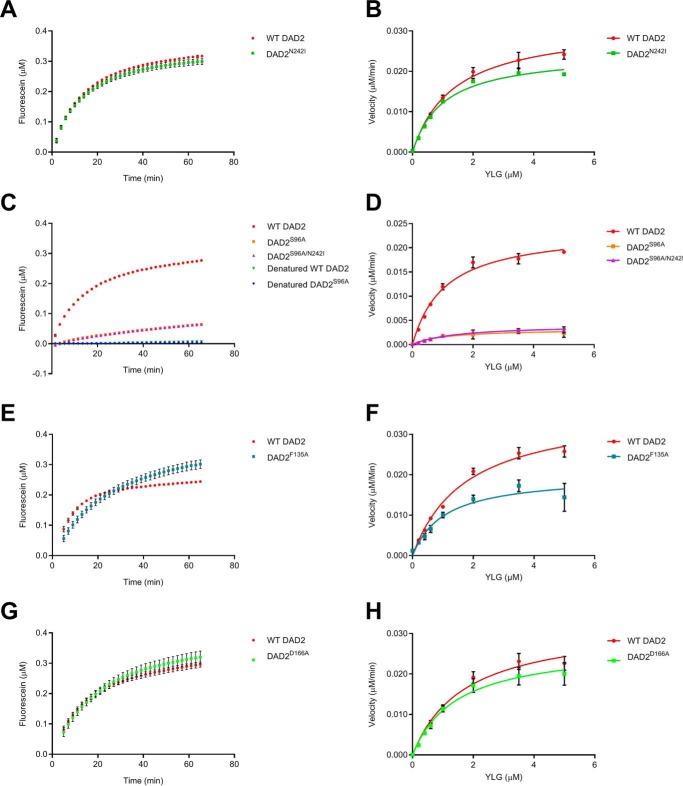
Figure 3.
Hydrolysis of YLG by DAD2 mutants. A, C, E, and G, time course hydrolysis of 1 μm YLG by DAD2 mutants (0.34 μm protein) over 60 min. Denatured DAD2WT (WT DAD2) and DAD2S96A (S96A) were used as negative controls. B, D, F, and H, hydrolysis of YLG by DAD2 mutants (0.34 μm protein) at various YLG concentrations. Each data point is the mean ± S.E. of three technical replicates.

