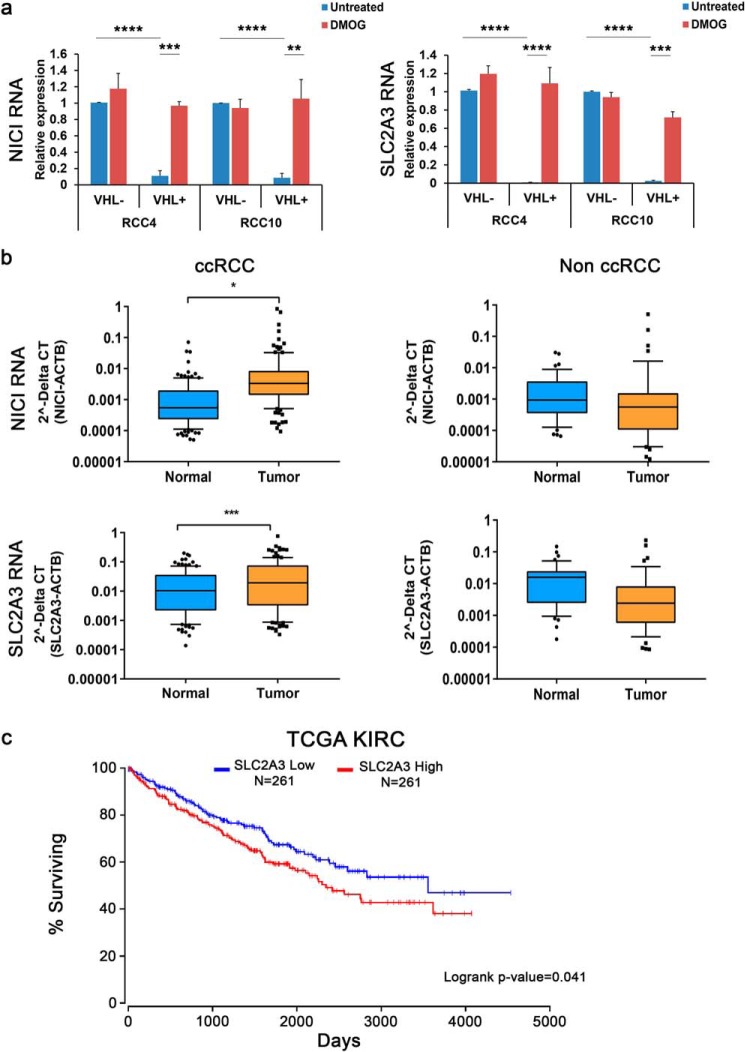
Figure 3.
Expression of NICI and SLC2A3 in renal cancer. a, NICI and SLC2A3 are regulated via VHL and HIF. Expression qPCR analysis of renal cancer cell lines RCC4 VHL ± and RCC10 VHL ± were treated with 1 mm DMOG for 16 h or left untreated. Values are mean ± S.D. from three independent experiments. b, box-and-whisker plot of RNA expression levels of NICI and SLC2A3 in samples from ccRCC (n = 126) and non-ccRCC (n = 35) from the Erlangen RCC cohort compared with corresponding normal renal tissue. Values were measured by qPCR and normalized to the expression levels of actin B (ACTB). The horizontal lines represent the average value, and the whiskers extent to the 10th and 90th percentile, respectively. Statistical analyses were performed using the two-sample t test (*, p < 0.05; **, p < 0.01; ***, p < 0.001; ****, p < 0.0001). c, Kaplan-Meier survival curve of renal cancer patients from the TCGA kidney renal clear cell carcinoma cohort stratified for high (red) or low (blue) SLC2A3 expression. Data were derived from oncolnc.org3 (49).

