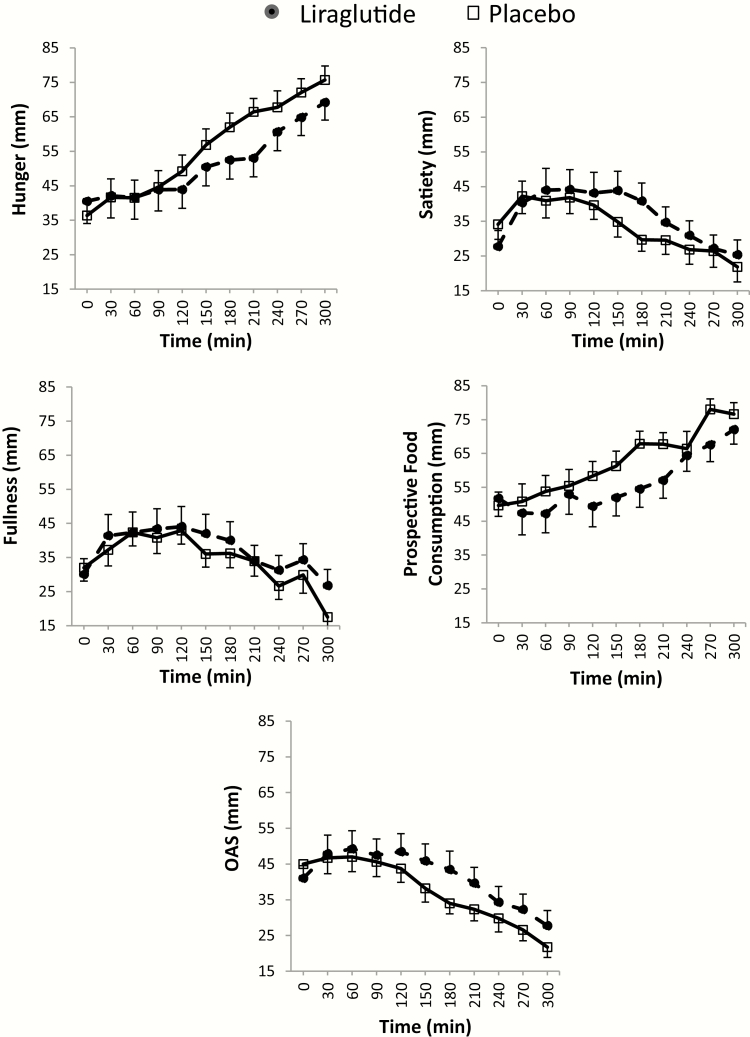
Figure 5.
Appetite ratings at 16 weeks in the two groups (assessed by visual analog scale, Fig. 2) following the ingestion of a standard liquid breakfast. For each timepoint (0–300 min), average score (± standard error of the mean) of all participants per group was obtained for this figure. AUC0-300 min for each parameter and statistical analysis results can be found in Table 1.
Abbreviations: OAS, overall appetite score = [satiety + fullness + (100 – hunger) + (100 – prospective food consumption)]/4.

