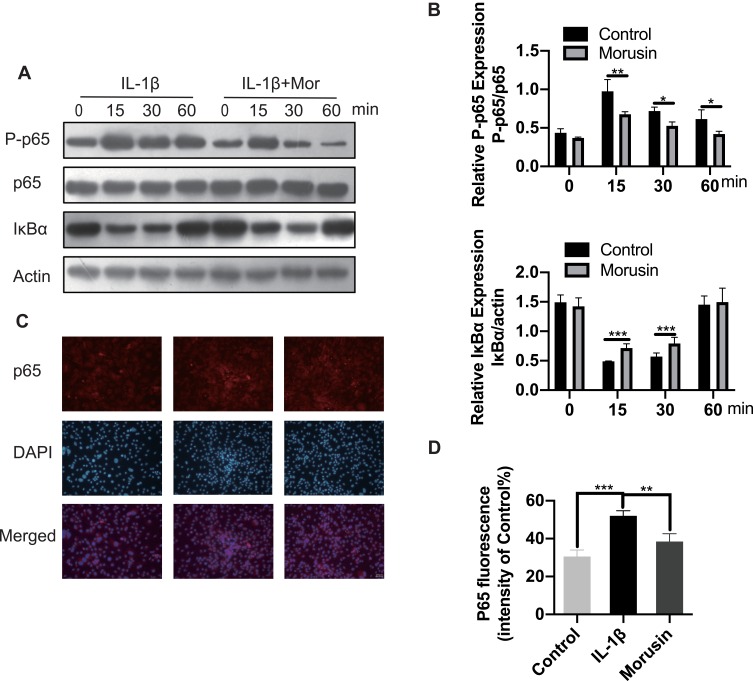
Figure 5.
Effect of Morusin on IL-1β-induced NF-κB activation on mouse chondrocytes. Chondrocytes cells were pretreated with Morusin (2 μM) for 2 h, followed by stimulation with or without IL-1β for the indicated time (0, 15, 30, 60 min). (A) and (B) Western blot was performed to measure the protein expression level of P-p65, p65, IκBα and actin. (C) and (D) Representative p65 was explored by immunofluorescent staining. The fluorescence intensity of p65 was determined using ImageJ software. Significant differences among the Morusin treatment groups are presented as *P < 0.05, **P < 0.01, ***P < 0.001 vs IL-1β treatment group, n = 3.

