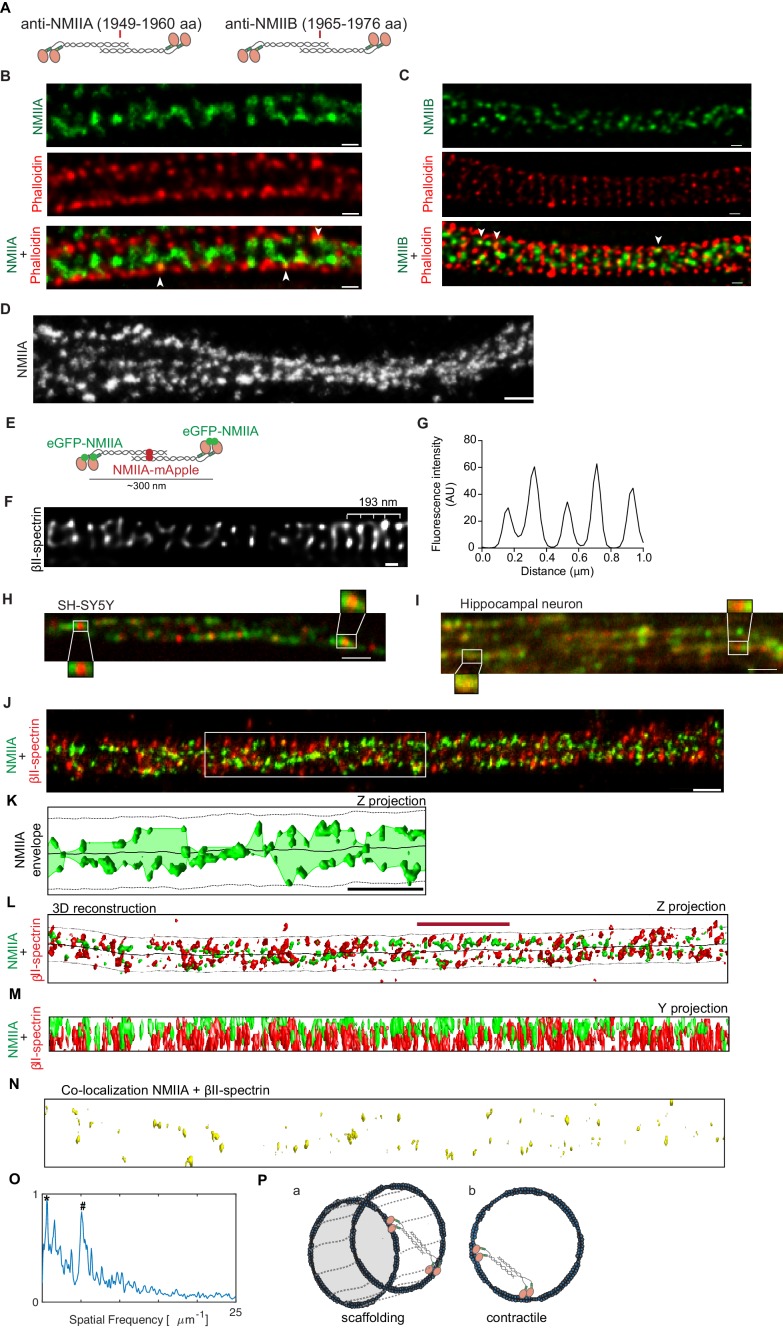
Figure 4. NMII heavy chains organize into filaments distributed in multiple orientations along the axon shaft.
(A) Representation of recognition sites of antibodies against NMIIA and NMIIB (NMIIA: 1949–1960 aa; NMIIB: 1965–1976 aa). (B) Representative STED analysis of a DIV8 hippocampal neuron co-stained with NMIIA using a secondary anti-rabbit STAR 580 (upper) and phalloidin 635 (middle); the merged image is shown in the lower panel. Scale bar: 200 nm. (C) Representative STED analysis of a DIV8 hippocampal neuron co-stained with NMIIB using a secondary anti-rabbit STAR 580 (upper) and phalloidin 635 (middle); the merged image is shown in the lower panel. Scale bar: 200 nm. (D) Z projection of 3D SMLM of an axon single labeled for NMII heavy chain A using an Alexa Fluor 647 labeled secondary antibody. NMIIA labeling following different orientations in relation to the axonal axis is highlighted with arrowheads. Scale bar: 500 nm. (E) Representation of a bipolar NMIIA filament, with the N-terminal eGFP tagged and the C-terminal mApple tagged. (F) SH-SY5Y was immunolabelled with βII-spectrin using a STAR 635P secondary and imaged using STED. Scale bar: 200 nm. The raw image was deconvolved using the CMLE algorithm (Huygens Professional, SVI). (G) Analysis of SH-SY5Y βII-spectrin periodicity related to (F). (H) Representative spinning disk image of SH-SY5Y after co-transfection with eGFP-NMIIA and NMIIA-mApple. Scale bar: 1 µm. Insets highlight bipolar NMIIA filaments of ~300 nm. (I) Representative spinning disk image of a primary hippocampal neuron axon after co-transfection with eGFP-NMIIA and NMIIA-mApple. Scale bar: 1 µm. (J) Z projection of a 3D SMLM double stained for βII-spectrin (red) and NMII heavy chain A (green) using anti-mouse Alexa Fluor 532 and anti-rabbit Alexa Fluor 647, respectively. Scale bar: 500 nm. (K) Analysis of the envelope of NMIIA labeling (Z projection) relative to the region highlighted by the white box in (J); the axonal membrane (dashed line) and centerline (solid line) are depicted. Scale bar: 1 µm. (L) Computer 3D reconstruction of the SMLM double stained for βII-spectrin (red) and NMII heavy chain A (green) of the image shown in (J). Solid line follows the axon centerline, whereas the dashed line marks the cellular membrane. The red scale bar is 1.7 µm, which corresponds to the size of the βII-spectrin secondary structure (see panel O). A Z projection is shown. (M) Y projection related to (J). (N) Co-localization of βII-spectrin and NMII heavy chain A for the reconstruction shown in (L). (Q) Fluorescence intensity spatial frequency of βII-spectrin on the axonal axis, analyzed by Fourier transform. In addition to the 0.20 µm peak (marked with ‘#”), there is also a consistent peak at 1.7 µm (marked with ‘*”). (P) Models for the distribution of the NMII along axons. NMII filaments may crosslink adjacent actin rings (model a) or span individual rings (model b), in both cases with variable angles relative to the axonal axis.

