. 2020 Mar 25;9:e51243. doi: 10.7554/eLife.51243

Figure 1. Sample phylogeny and distribution.

(A) Phylogeny of all 151 samples of the L. donovani complex. The phylogeny was calculated with neighbour joining based on Nei's distances using genome-wide SNPs and rooted based on the inclusion of isolates of L. mexicana (U1103.v1), L. tropica (P283) and L. major (LmjFried) (outgroups not shown in the phylogeny). Bootstrap support is shown for prominent nodes in the phylogeny as black circles for values of 100% and otherwise the respective support value in % based on 1000 replicates. The groupings shown in the outer circles were calculated by admixture with K = 8, K = 11 and K = 13 (see Materials and methods). Groups labelled with different colours were defined based on the phylogeny and include monophyletic groups as well as groups that are polyphyletic and/or largely influenced by hybridisation (indicated by ‘other’). (B) Map of the sampling locations. Groups are indicated by the different colours. Sample sizes by country of origin are visualised by the sizes of the circles.

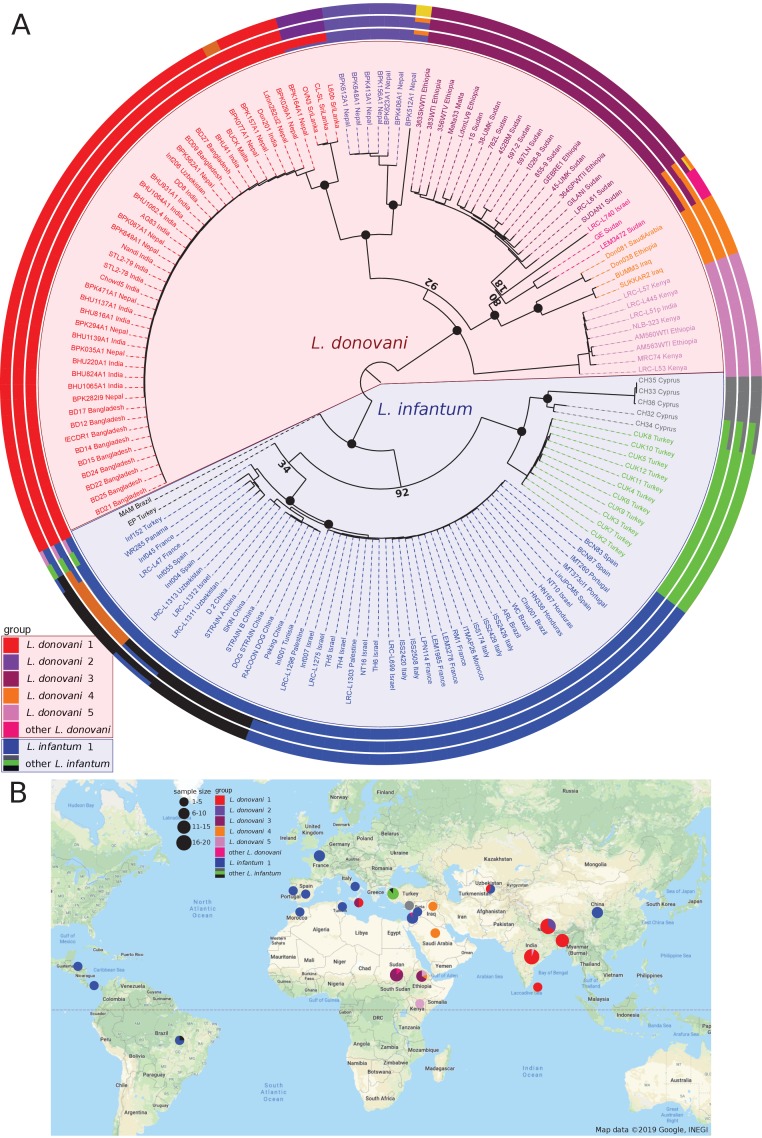
Figure 1.

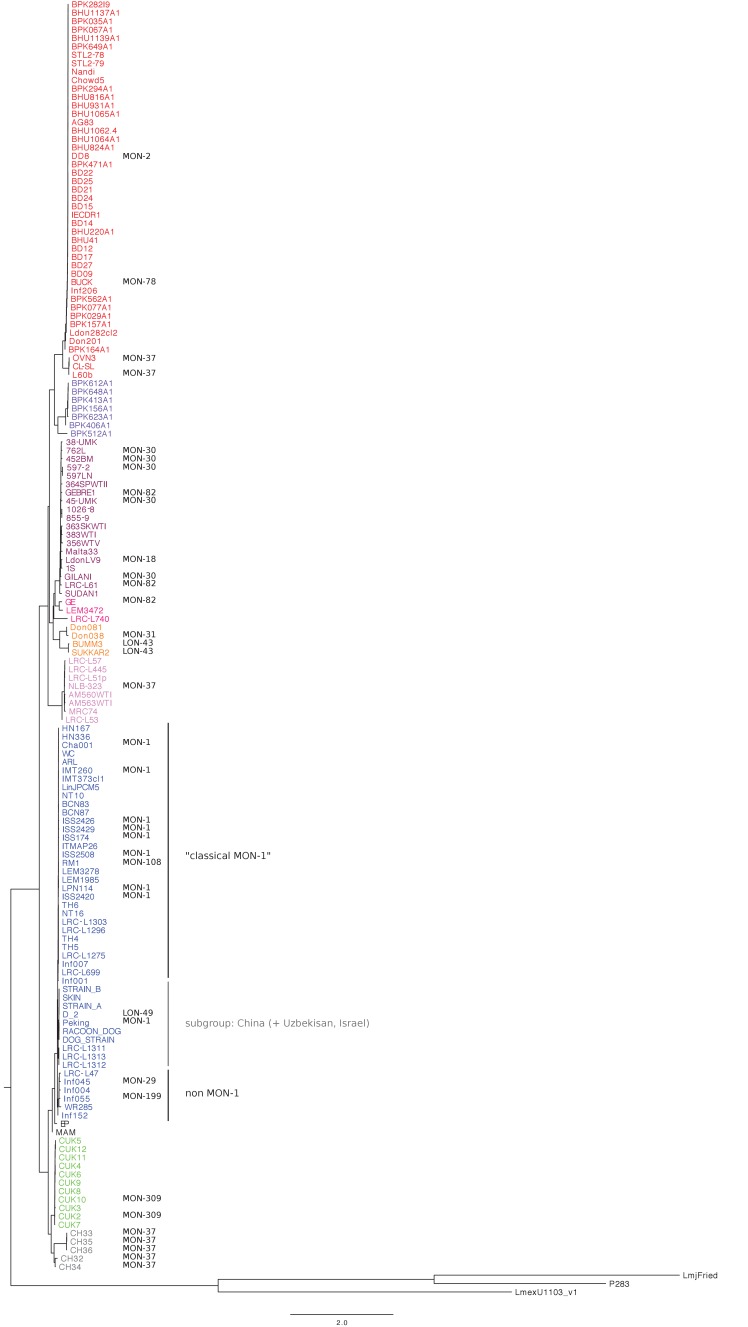
Figure 1—figure supplement 1. Phylogenetic reconstruction of all 151 samples of the L. donovani complex.

Figure 1—figure supplement 1.

The phylogeny was calculated with neighbour joining based on Nei's distances including isolates of L. mexicana (U1103.v1), L. tropica (P283) and L. major (LmjFried) as outgroups. Group colours are identical to those used throughout the manuscript. Phylogenetic grouping as suggested by Multilocus Enzyme Electrophoresis are indicated in black (see Supplementary file 1 for references).
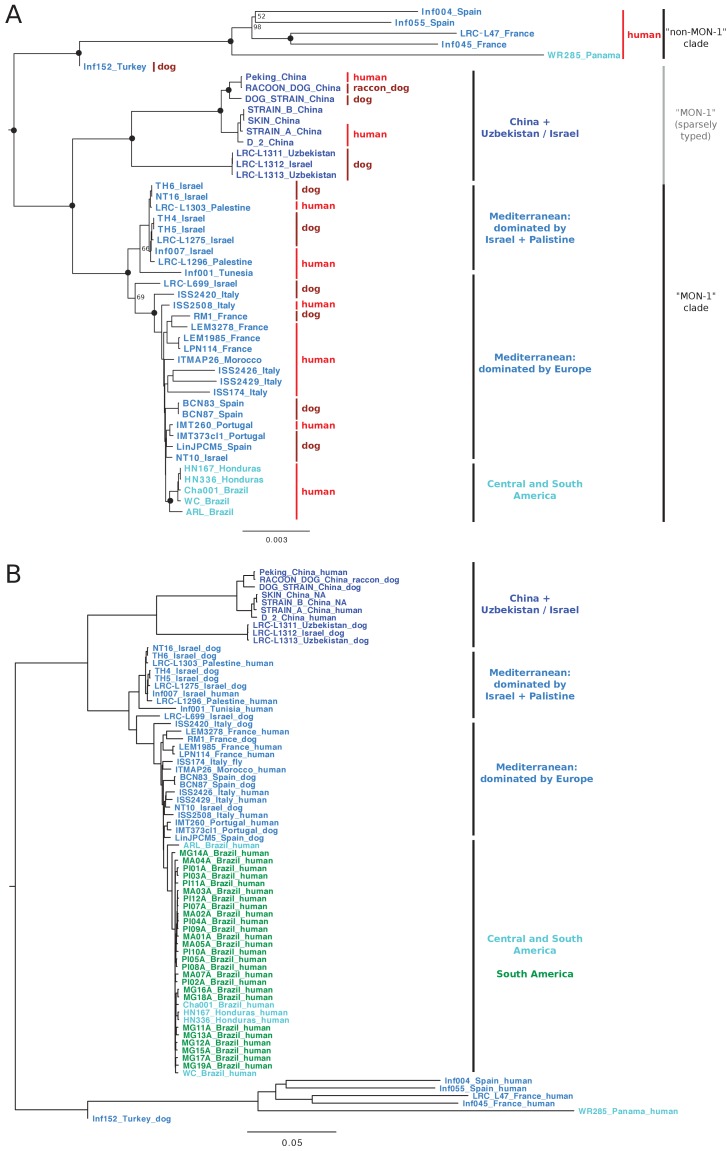
Figure 1—figure supplement 2. Sample phylogeny of the Linf1 group.

Figure 1—figure supplement 2.

(A) The phylogeny displays a sub-tree of the phylogeny in Figure 1. Bootstrap values are shown for prominent nodes in the phylogeny as black circles for values of 100 and otherwise the respective support value. The two main subclades differentiate MON-1 from non-MON-1 samples (annotation based on Figure 1—figure supplement 1) and sample colours indicate the geographic origin, that is Asia (dark blue), Mediterranean (pale blue) and South American (turquois). Sample names are annotated by their country of origin. The host the parasite was isolated from is indicated in bright and dark red, respectively. (B) Phylogeny of Linf1 samples including additional strains isolated from human infections from three different states in Brazil: Maranho (MA), Minas Gerais (MG) and Piau (PI) (Carnielli et al., 2018) (coloured in green).