. 2020 Mar 25;9:e51243. doi: 10.7554/eLife.51243

Figure 5. LD decay with genomic distance.

(A) LD decay was measured for the six largest groups removing isolates that were identified as putative strain mixtures (indicated by *; see Materials and methods). Groups with more than seven isolates per group were sub-sampled to three pseudo-replicates of seven isolates (round symbols) to make LD estimates comparable between groups. Mean and standard deviation across the three pseudo-replicates are shown where applicable. Groups with only seven isolates were not sub-sampled and are indicated by squared symbols. (B) LD decay with distance is shown for the three pseudo-replicates for the Ldon1 group. (A and B) Data for individual replicates was calculated as means of 1 kb windows for SNP pairs of the stated genomic distance. For LD estimates between chromosomes, 100 SNPs were randomly sampled per chromosome and means across all pair-wise combinations between chromosomes are shown. This procedure was done twice independently but as differences between both such replicates were negligible, only the results of one replicate are shown.

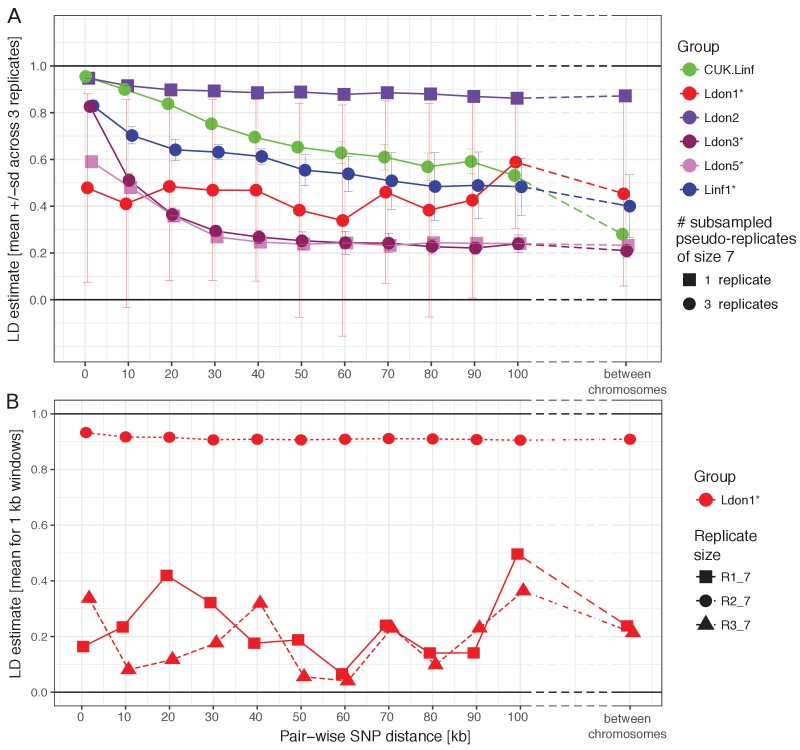
Figure 5.

Figure 5—figure supplement 1. LD decay with genomic distance.

Figure 5—figure supplement 1.

LD decay was measured for the six largest groups removing isolates that were identified as putative strain mixtures (indicated by *; see Materials and methods). Shown are means of 1 kb wide windows for SNP pairs of the stated genomic distance. For LD estimates between chromosomes, 100 SNPs were randomly sampled per chromosome and means across all pair-wise combinations between chromosome are shown. This procedure was done twice independently but as differences between both such replicates were negligible only the results of one replicate are shown. Samples sizes used for LD estimates vary between groups depending on the group size.
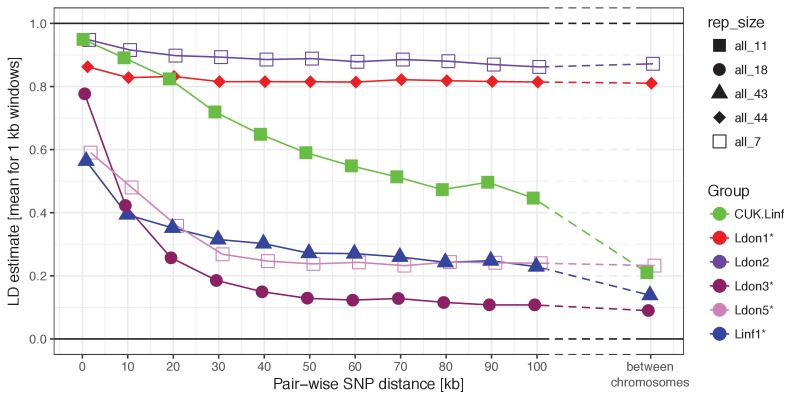
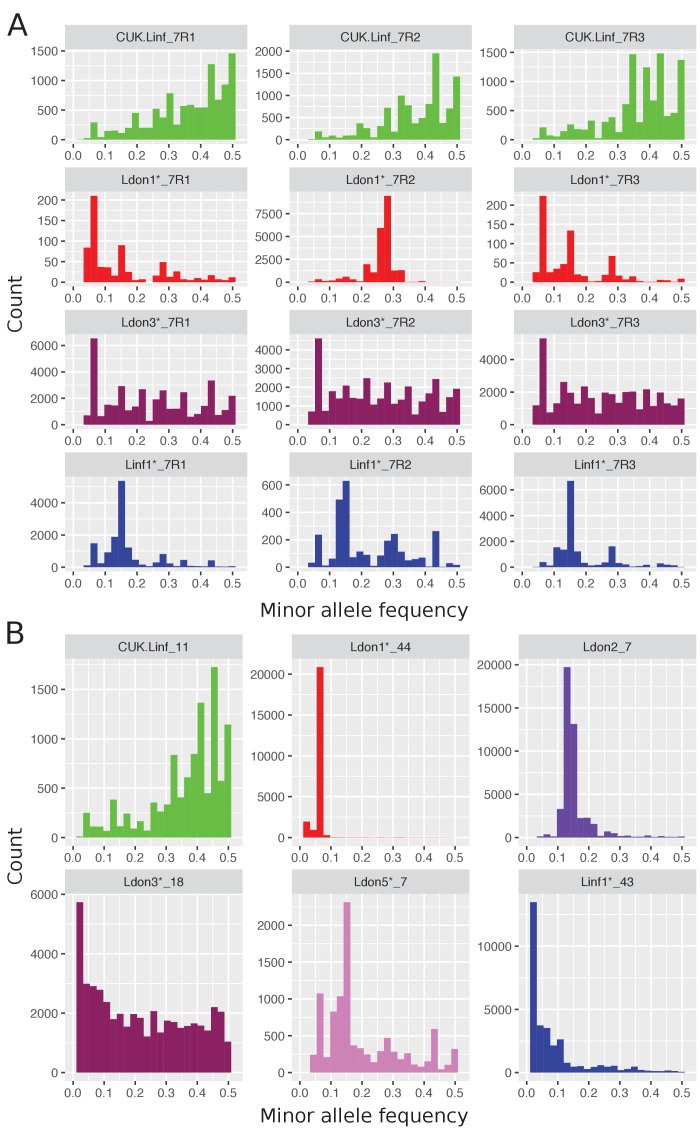
Figure 5—figure supplement 2. Folded site frequency spectra of the six largest groups.

Figure 5—figure supplement 2.

(A) The six largest groups were randomly sub-sampled to seven samples into three pseudo-replicates and respective SFS are shown. (B) SFS are shown for the six largest groups including all available samples. Group names are indicated at the top of each plot. Asterisks indicate that samples that were identified as clone mixtures were removed (see Materials and methods). Sample size and replicate number if applicable are written next to the group names.