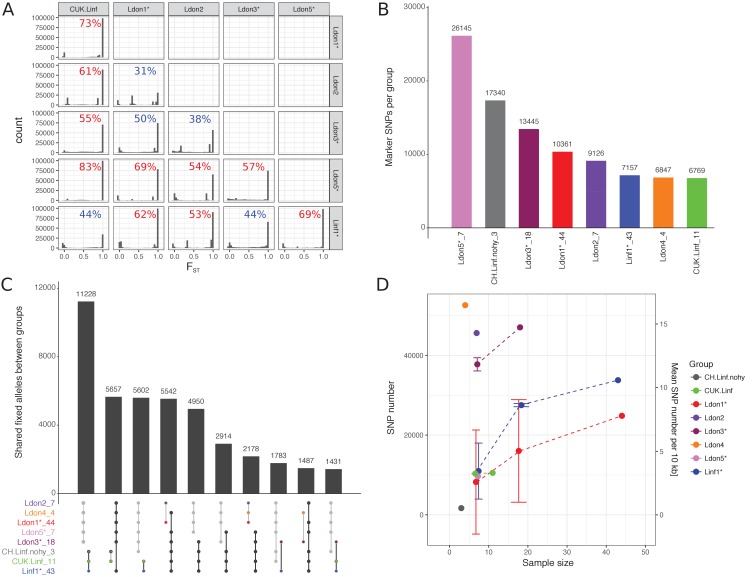
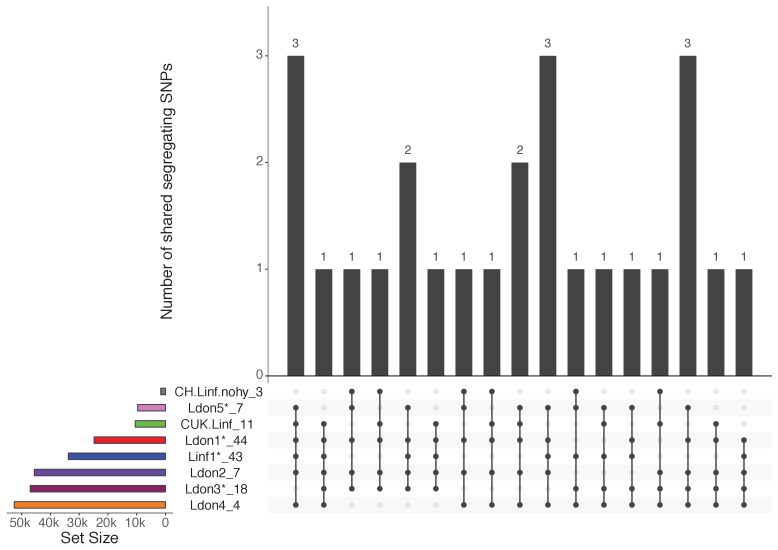
Figure 6. Differentiated and segregating SNPs between and within groups.
For this analysis isolates that were shown to be mixtures of clones or hybrids between groups were removed (indicated by ‘*’, see also Materials and methods). Groups sizes after removal of those isolates are specified in panels A and C. (A) FST values between pairwise group comparisons. The fraction of differentially fixed SNPs (FST = 1) for each pairwise group comparison is indicated at the top right corner of each plot. Percentages larger than 50% are coloured in red, otherwise blue. (B) The number of marker SNPs for each group, that is SNPs that are differentially fixed in one group versus all others. (C) Number of SNPs that are differentially fixed between sets of groups. Groups fixed for the same allele are indicated in the bottom panel through connecting points corresponding to the specific groups. Grey and black lines connect sets of groups monomorphic for the alternate and reference allele, respectively. (D) Number and density of SNPs segregating in the respective groups. As sample sizes of the different groups vary, figures are also shown for three random sub-samples of the larger groups. Results of sub-sampling are displayed as mean and sd.


