. 2020 Mar 25;9:e51243. doi: 10.7554/eLife.51243

Figure 7. Two large CNVs that are shared between both species.

(A) Chromosome 27 has a 25 kb long deletion that is present in 15% of all samples and four different groups. All chromosomes 27 that have this deletion in our dataset are diploid and the deletion results in a loss of this allele in the respective sample. (B) The duplication on chromosome 35 is 235 kb long and present in one isolate of group Ldon1 and Linf1, respectively. The insertion is once present on a disomic background with a 2-fold increase and once on a trisomic background with a 1-fold increase. The green rectangle marks the CD1/LD1 locus sequences for L. infantum described in Sunkin et al. (2001) (Supplementary file 8). For A) and B) a few closely related samples not harbouring the respective CNV are also displayed and highlighted in dark grey. Group identities are indicated by colours of the isolate name. (C) Genes present in the respective CNV along with GO enrichment results using topGO (Alexa et al., 2006). Details on both CNVs can be found in Supplementary file 7: unique CNVs with ids 150 and 215, respectively. The CNV characterisation of the corresponding isolates can be found in Supplementary file 6.

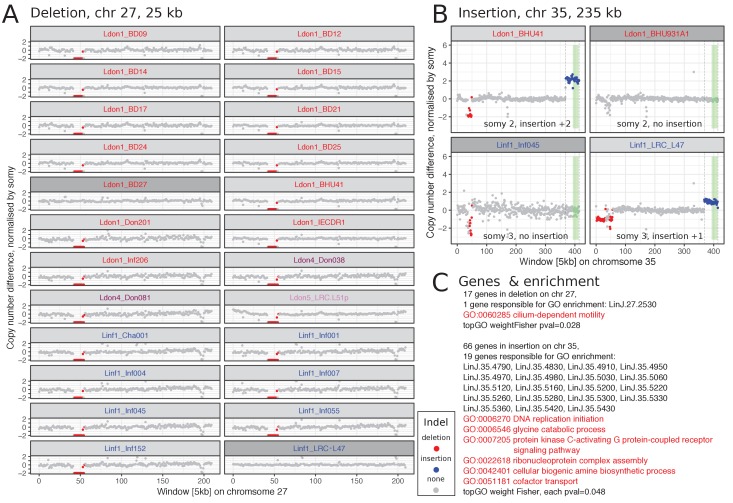
Figure 7.

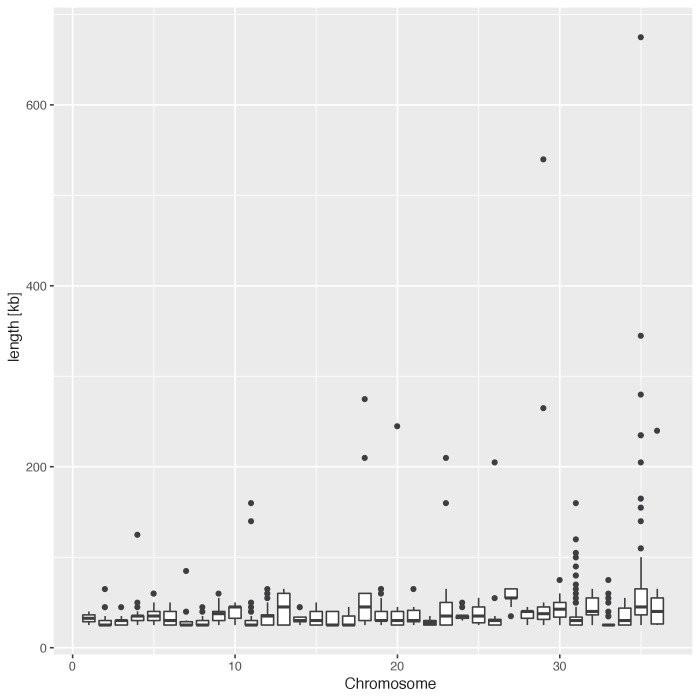
Figure 7—figure supplement 1. Length distribution of large CNVs by chromosome.

Figure 7—figure supplement 1.

Large CNVs were called using a minimum length threshold of 25 kb (see Materials and methods).
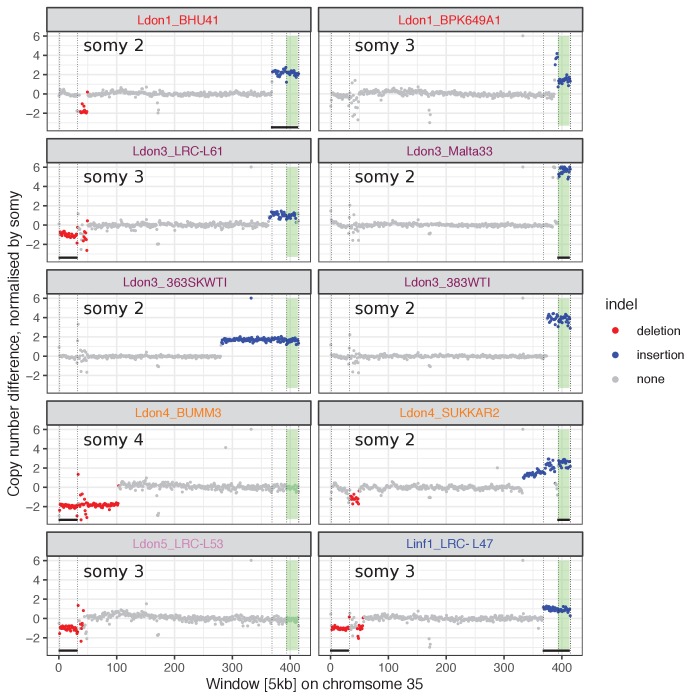
Figure 7—figure supplement 2. Most chromosome scale CNVs are located on chromosome 35.

Figure 7—figure supplement 2.

Shown are genome coverages of chromosome 35 for all samples that harbour at least one chromosome-scale CNV (>100 kb). Genome coverage for 5 kb windows was normalised by the sample and chromosome specific somy and coloured in red and blue for duplications and deletions, respectively. The respective chromosome-specific somy is indicated in each plot. Vertical lines mark indel boundaries and horizontal black bars below indicate indels with shared identical boundaries between samples. The green rectangles mark the CD1/LD1 locus sequences for L. infantum described in Sunkin et al. (2001). Group origin of the different samples is indicated by the group colours used throughout this study.
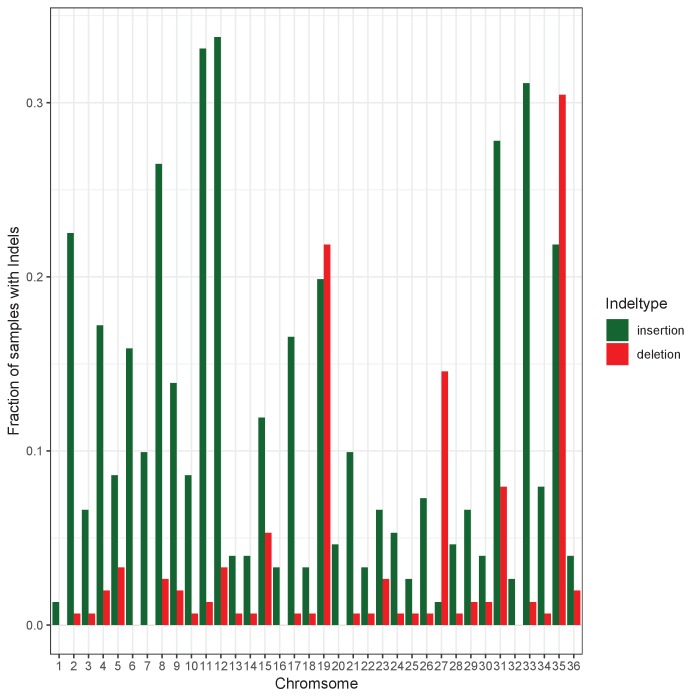
Figure 7—figure supplement 3. Fraction of large CNVs across chromosomes.

Figure 7—figure supplement 3.

Shown is the fraction of all 151 samples that contain at least one large copy number variant (>=25 kb; see Materials and methods) of the respective type for each chromosome.
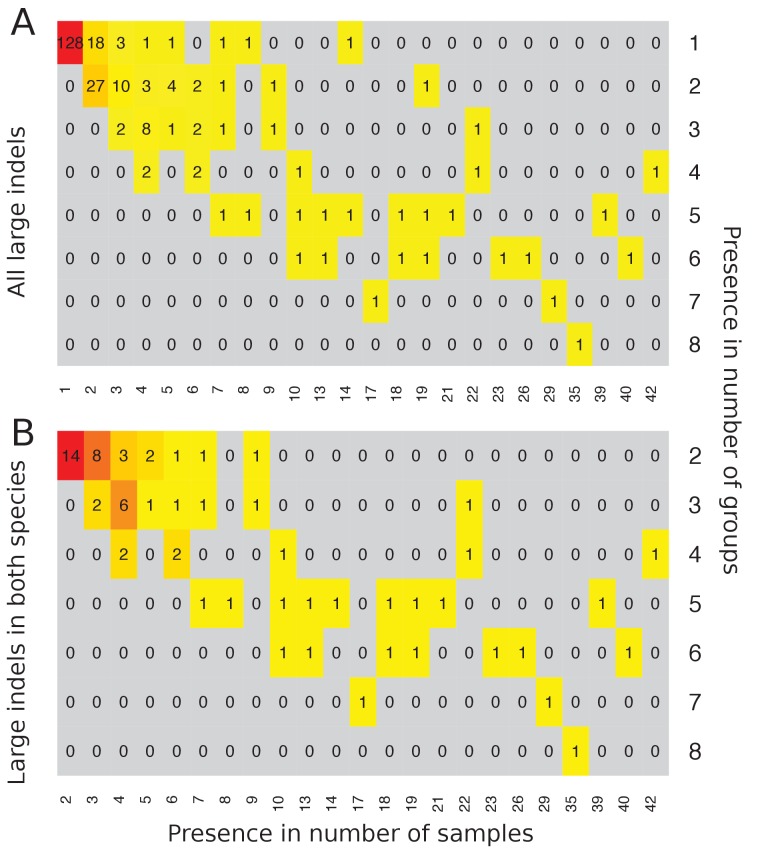
Figure 7—figure supplement 4. Large CNVs shared across samples and groups.

Figure 7—figure supplement 4.

Sharing of large CNVs (>=25 kb) is shown between samples and groups. (A) All large CNVs identified across all 151 isolates. (B) All large CNVs that have been found in both species, L. donovani and L. infantum.
Figure 7—figure supplement 5. Increased coverage of samples towards chromosome ends.

Figure 7—figure supplement 5.

Samples are shown with called duplications at chromosome ends that show a gradual coverage increase. Plots show median window coverage across 5 kb windows. Called duplications are indicated by blue dots and boundaries are indicated by vertical bars. (A) Examples for chromosome 3. (B) Examples for chromosome 9.
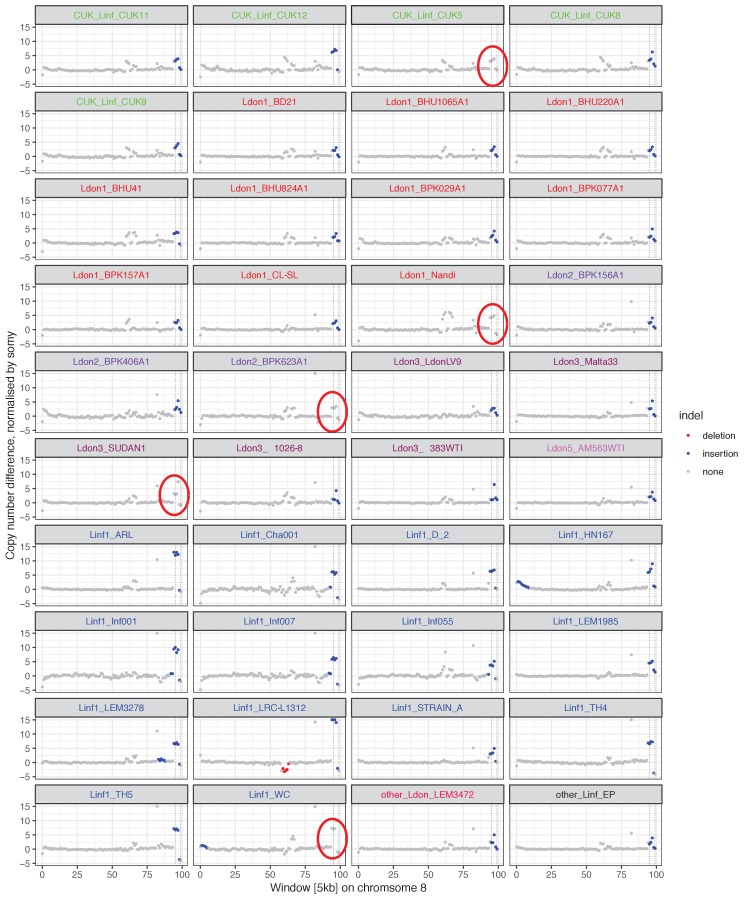
Figure 7—figure supplement 6. Indication of a putative assembly error in the reference genome.

Figure 7—figure supplement 6.

A common duplication of 25 kb on chromosome 8, position 470–495 kb, was found in 35 samples across eight different groups (indicated by vertical bars and highlighted in blue). When inspecting remaining samples, however, a copy number increase was also present in all other 116 remaining samples, which failed to meet the CNV calling threshold. Five of these 116 samples are also shown and the non-called copy number increase is indicated by a red circle. As the copy number increase varies between samples, these regions may still be copy number variable between isolates.
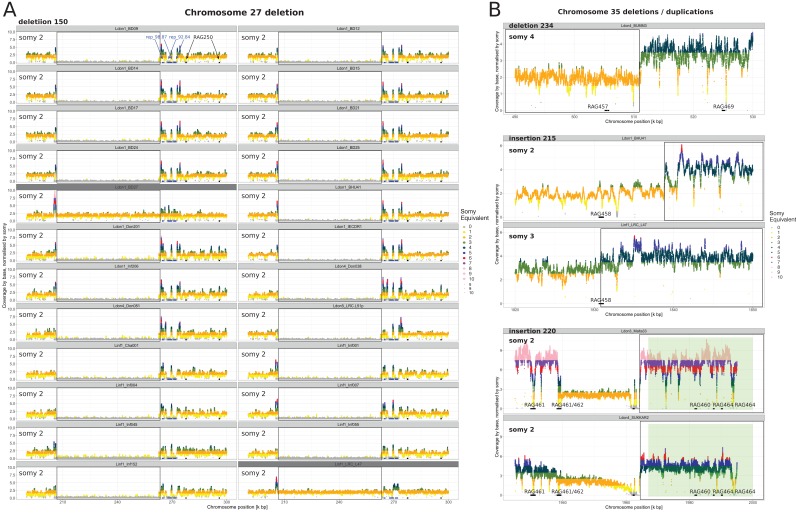
Figure 7—figure supplement 7. CNV association with repeat sequences in the genome.

Figure 7—figure supplement 7.

The per base coverage is shown for break-point regions of insertions on chromosomes 27 A) and 35 B) in relevant strains (Figure 7 and Figure 7—figure supplement 2). The sequencing coverage is normalised by the haploid sequencing coverage estimated across all chromosomes for the respective strain. The somy of the respective strains and chromosome are indicated in the left top corner of each subplot and the local ‘somy equivalent’ is indicated by the respective colour. Repeated sequences described in Ubeda et al. (2014) are indicated by black bars and annotated with their repeat alignment group (RAG). Newly identified repeated sequences that were not present in the reference genome version used by Ubeda et al. (2014) are indicated by blue bars and are annotated with identity between two repeated sequences (A, see Figure 7—figure supplement 8). The copy number variant type, that is insertion/deletion is indicated in the top left corner of each subplot along with its id as stated in Supplementary file 7 and the region of the respective variant is indicated by a black frame. For deletion 150 in chromosome 27 the coverage is additionally shown for two samples that do not harbour the deletion as a control (indicated by a dark grey header, (A). The first half of CD1/LD1 locus sequences described in Sunkin et al. (2001) is present in the breakpoint region of insertion 220 and is indicated by the green rectangle (B).
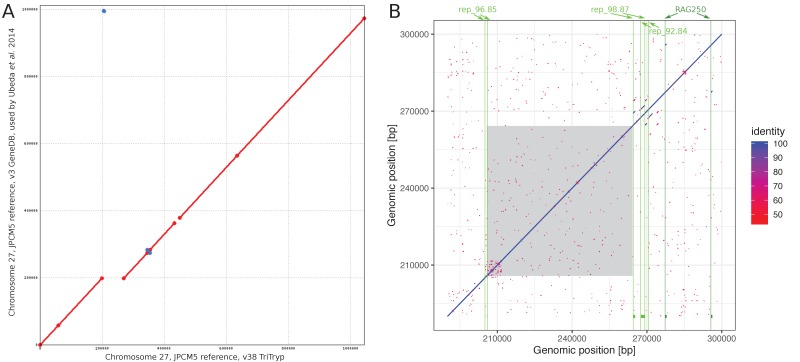
Figure 7—figure supplement 8. Identification of novel repeated sequences on chromosome 27.

Figure 7—figure supplement 8.

(A) Positions 199,468–269,164 in the L. infantum JPCM5 reference genome (TriTrypDB, (v38) were not present in the reference assembly used by Ubeda et al. (2014). (B) Repeated sequences within chromosome 27, positions 190,000–300,000 in the reference genome, JPCM5 (TriTrypDB v38). The dot plot shows the comparison of the sequence region against itself. Similar sequences are coloured by their % identity. The grey shaded area indicates the common deletion found in a subset of all our strains (Figure 7A, Figure 7—figure supplement 7A). Green bars at the bottom indicate the location of repeat regions with a vertical line indicating their start position. Dark green indicated repeats originally described in Ubeda et al. (2014) and light indicates newly identified repeats. Coordinates of the newly identified repeats are summarised in Supplementary file 13.