. 2020 Mar 30;9:e53078. doi: 10.7554/eLife.53078

Figure 5. Multi-spacer colonies display sectored morphologies.

(A) Image of a smooth colony (containing the founder spacer UU) as well as the gel agarose analysis of PCR products obtained after amplification of its pCRISPR array; ‘c’ shows amplification of pCRISPR, a no-spacer control. (B) Same as (A) but for the sectored colony founded by spacer XX. Also showing the gel agarose analysis of PCR products obtained after amplification of its pCRISPR array present in three different sectors (α,β,γ) with a schematic of the pCRISPR array determined after sequencing of the PCR product (L, leader; black rectangle, repeat; colored boxes, acquired spacers with different colors indicating different spacer sequences within a colony). (C) Images of representative colonies grown 24 or 48 hr after top agar infection of wild-type or Δcas2 mono-spacer founder F cells, with ϕNM4γ4 containing or not additional spacer F escaper phage. Glitter markers are shown to normalize both the position as well as the size of the image at different times. (D) Images of representative colonies of wild-type or Δcas2 mono-spacer founder F cells grown for 24 hr in the absence of phage, when a drop of either PBS or spacer F escaper phage was added on top and a second image was obtained 24 hr after. Glitter markers are shown to normalize both the position as well as the size of the image at different times.

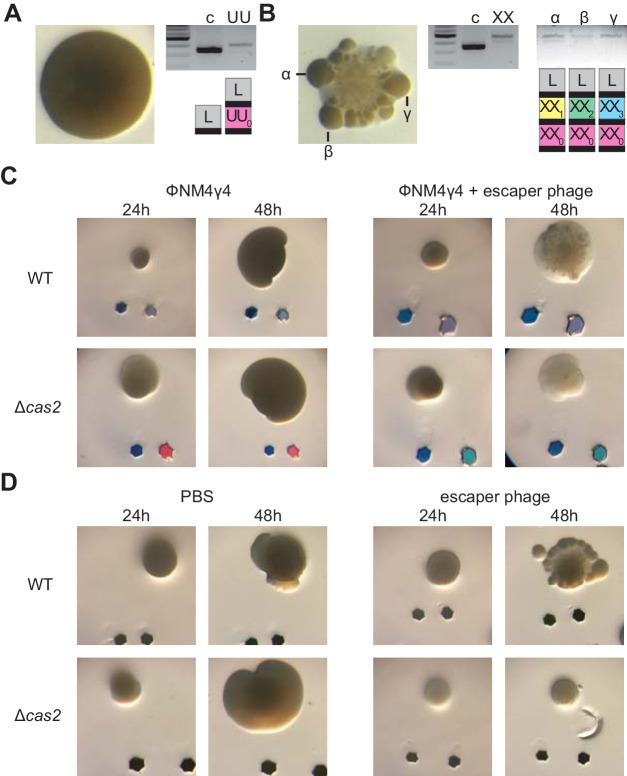
Figure 5.

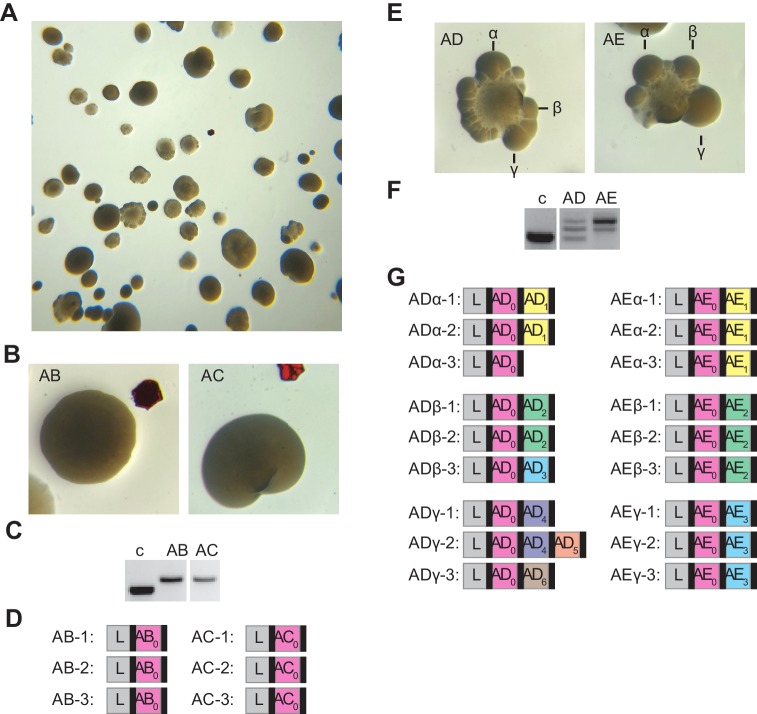
Figure 5—figure supplement 1. Analysis of additional smooth and sectored colonies.

Figure 5—figure supplement 1.

(A) Image of a plate containing staphylococci carrying pCRISPR that survive ϕNM4γ4 infection in solid media. (B) Image of two smooth colonies (containing the founder spacers AB and AC) from the plate shown in (A). (C) Gel agarose analysis of PCR products obtained after amplification of the pCRISPR array of the smooth colonies shown in (B); ‘c’ shows amplification of pCRISPR, a no-spacer control. (D) Sequencing results of the PCR products shown in (C), shown as a schematic of the pCRISPR array (L, leader; black rectangle, repeat; colored boxes, acquired spacers with different colors indicating different spacer sequences within a colony). (E–G) Same as (B–D) but showing the analysis of two sectored colonies founded by spacers AD and AE; and also showing the sequencing of the pCRISPR array present in three different re-streaked sectors (α,β,γ).
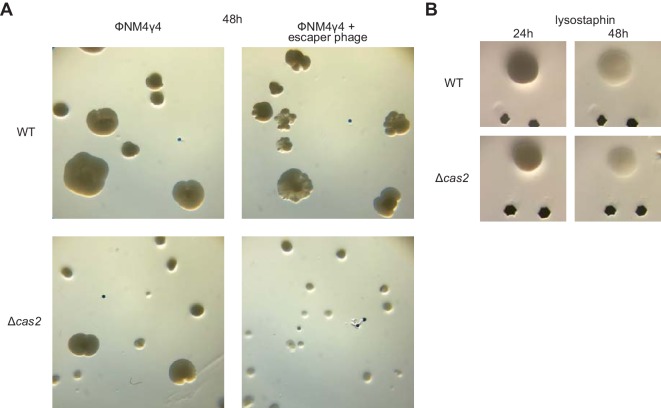
Figure 5—figure supplement 2. Requirement of spacer acquisition for the formation of sectored colonies.

Figure 5—figure supplement 2.

(A) Images of a plate grown for 48 hr after top agar infection of wild-type or Δcas2 mono-spacer founder F cells, with ϕNM4γ4 containing or not additional spacer F escaper phage. (B) Images of representative colonies of wild-type or Δcas2 mono-spacer founder F cells grown for 24 hr in the absence of phage, when a drop of the cell wall degrading enzyme lysostaphin was added on top and a second image was obtained 24 hr after. Glitter markers are shown to normalize both the position as well as the size of the image at different times.