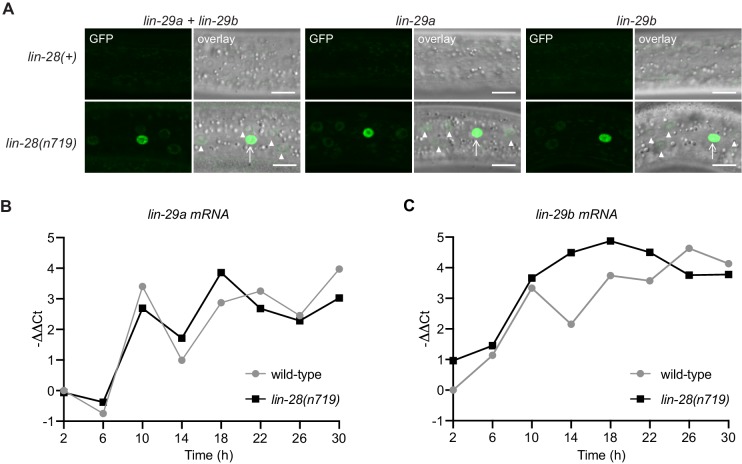
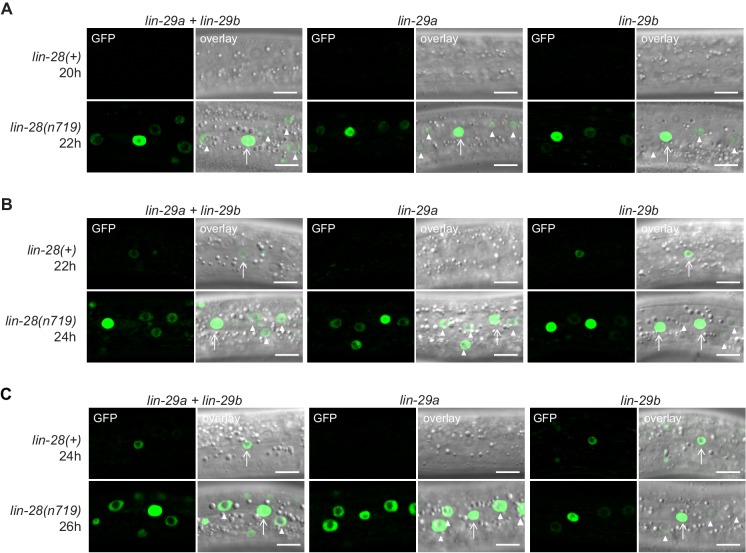
Figure 10. LIN-28 coordinates both lin-29a and lin-29b regulation.
(A) Confocal images of endogenously tagged LIN-29 protein isoforms in wild-type or lin-28(n719) background in the epidermis (strains HW1822, HW1826, HW1835, HW1924, HW1925, HW1926). Animals were grown at 25°C for 20 hr (control strains) and 22 hr (lin-28(n719) strains) to reach an equivalent early L3 developmental stage. Arrows indicate seam cell, arrowheads hyp7 nuclei. Scale bars: 10 μm. (B) RT-qPCR analysis to measure the -∆∆Ct of lin-29a mRNA levels in wild-type and lin-28(n719) mutant background (normalized by act-1 mRNA levels) over time. (C) RT-qPCR analysis to measure the -∆∆Ct of lin-29b mRNA levels in wild-type and lin-28(n719) mutant background (normalized by act-1 mRNA levels) over time.


