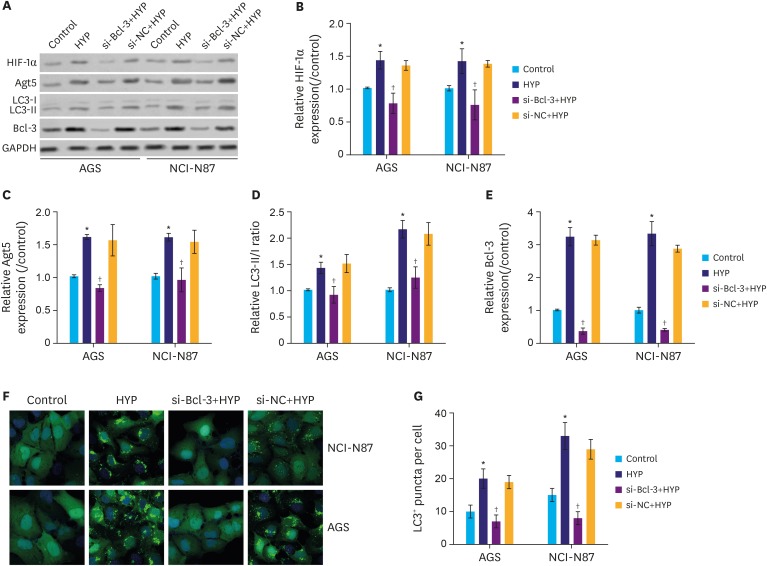
Fig. 3. Knockdown of Bcl-3 decreases HYP-induced autophagy. Relative expression of HIF-1α, Atg5, and LC3 were analyzed in AGS and NCI-N87 by western blotting. (B-E) Quantification of the relative protein levels of HIF-1α, Atg5, Bcl-3, and LC3 in AGS and NCI-N87 cells. (F,G) Immunofluorescence assay for LC3. LC3 positive puncta in individual cells are shown.
Bcl-3 = B-cell lymphoma 3; HIF-1α = hypoxia-inducible factor-1α; HYP = hypoxia; si-Bcl-3 = si-RNA-Bcl-3; si-NC = si-negative control; GAPDH = glyceraldehyde 3-phosphate dehydrogenase.
*P<0.05 (compared to control); †P<0.05 (compared to HYP).

