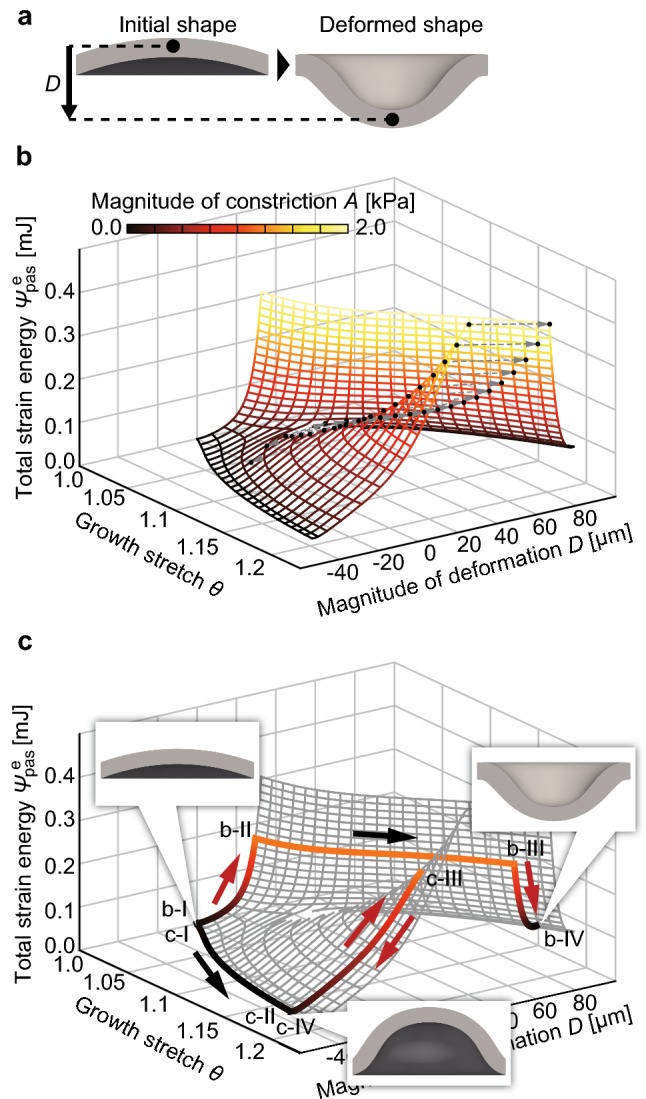
Fig. 2.

Energy landscape of morphogenesis of the sheet-like tissue. a Definition of deformation D [μm]. b The overview of the energy landscape, which shows the relationship between the strain energy [mJ], deformation D [μm], and growth stretch θ. Curves drawn on the surface of the landscape indicate paths of constant growth stretch and magnitude of constriction A [kPa]. Dotted lines connect two points before and after a snap through buckling. The color map represents the magnitude of constriction A [kPa]. c The paths in the two cases where constriction occurred before and after growth. The transitions of the tissue state in these simulations are represented as the colored paths on the energy landscape. The snapshots of the tissue shown in the energy landscape represent the tissue morphologies at each point
