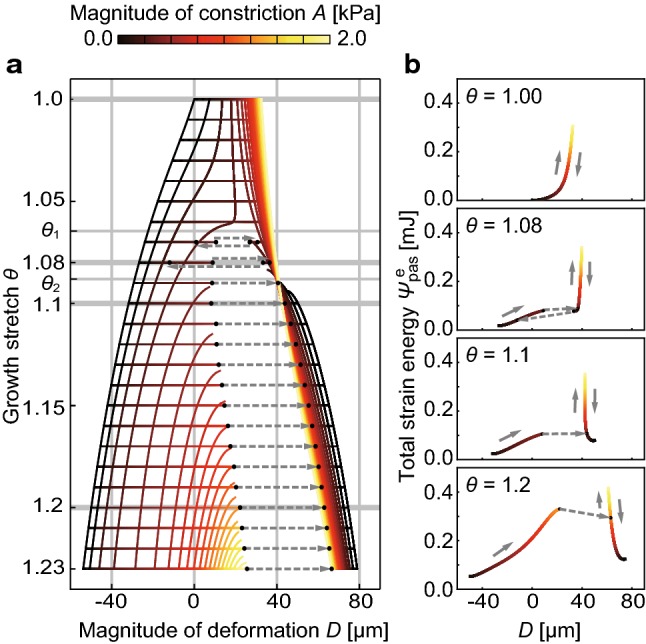
Fig. 3.

Projections of the energy landscape to the D–θ plane and D– plane. a The relationship between the deformation D and growth stretch . and are the values at which tissue deformations qualitatively changed. The color map represents the magnitude of constriction A.b Typical changes in the strain energy and deformation D while the growth stretch takes a constant value . The arrows indicate the transition of the tissue state when the magnitude of constriction A increases and then releases
