
Fig. 10.
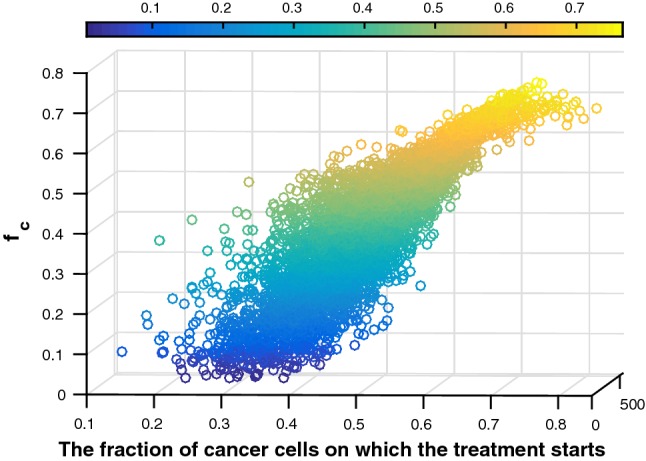
Three-dimensional scatter plot of fraction of cancer cells at which the treatment is started, injection time interval and final fraction of cancer cells. The color bar indicates the final fraction of cancer cells. Blue colors indicate low final fractions of cancer cells, whereas yellow colors indicate high fractions of cancer cells. Hence, blue colors are favorable, whereas yellow colors are not