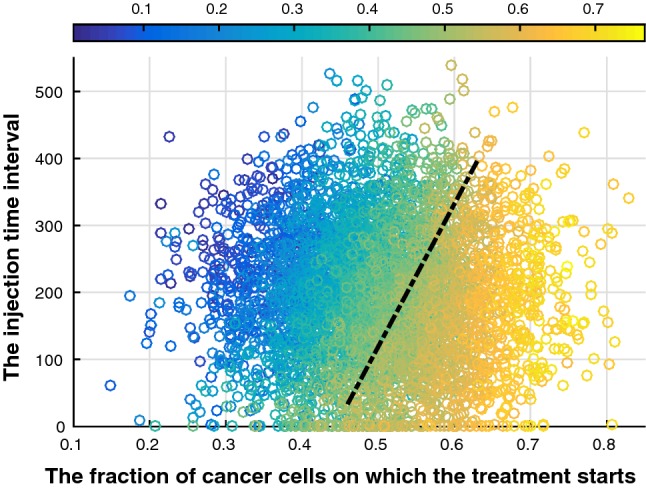
Fig. 11.

Scatter plot of the fraction of cancer cells on which the treatment starts, injection time interval and final fraction of cancer cells. Blue colors indicate low final fractions of cancer cells, whereas yellow colors indicate high fractions of cancer cells (see colorbar). Hence, blue colors are favorable, whereas yellow colors are not. A dashed black line is used to divide the potential consequences into two parts, where the likelihood of cure in the left side is higher, whereas the right side part hints a high risk of malignant cancer and even metastasis
