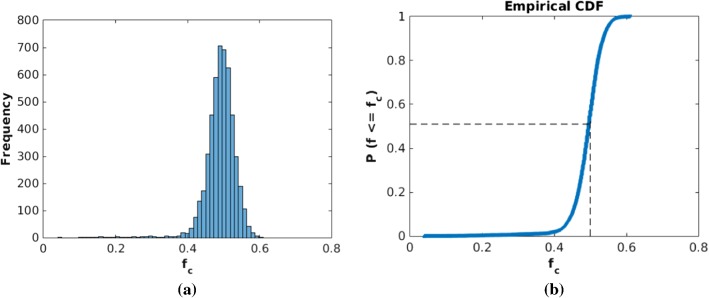
Fig. 4.
Histogram and CDF plot of outcomes at time of Monte Carlo simulations with 5000 samples. a There is no drug intervention. The x-axis shows the final fraction of cancer cells in total cells and the y-axis is its corresponding frequency of occurrence. b Cumulative probability based on the histogram in (a), where f is the dynamic fraction of cancer cells at time

