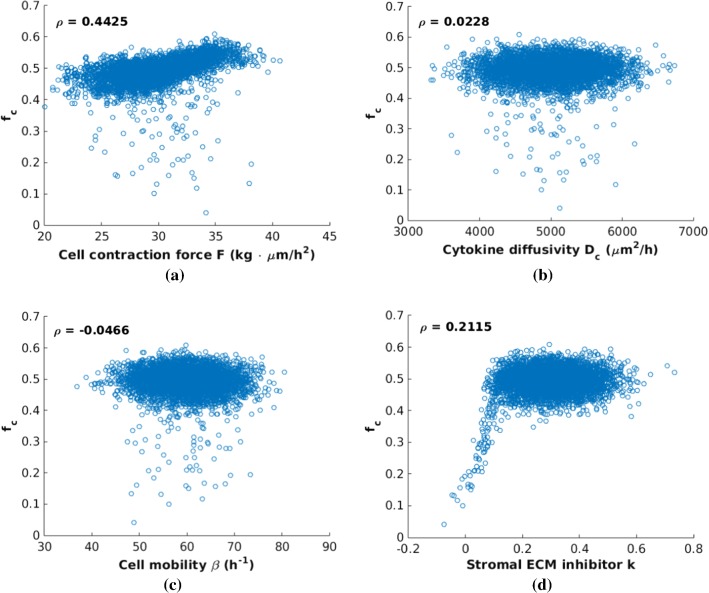
Fig. 5.
Scatter plots of the final fraction of cancer cells at time = 80 h versus parameters F, , and k, respectively. The in each subfigure corresponds to its correlation coefficient. In comparison, d exhibits a significant correlation between and the desmoplastic ECM inhibition faction k from 0 to 0.15

