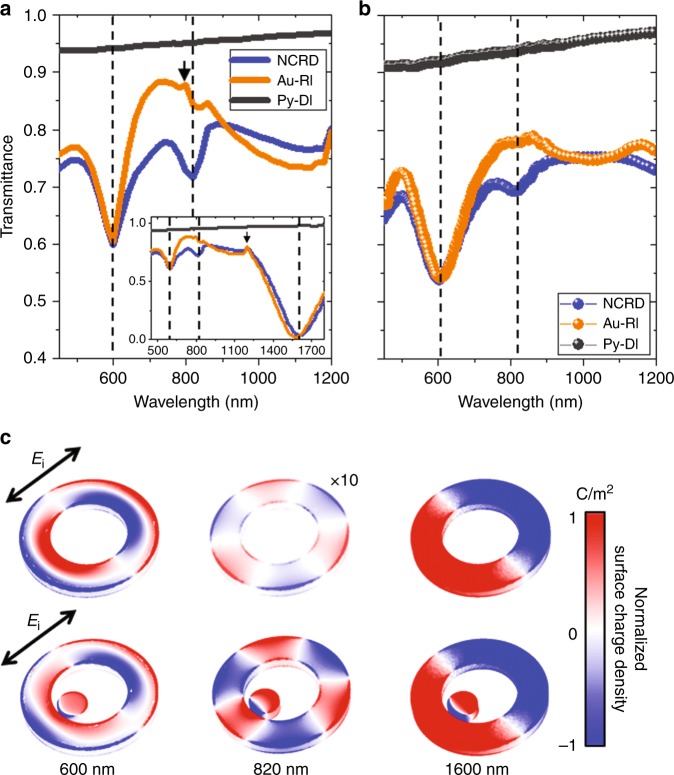
Fig. 2. Au-RI and NCRD optical properties and modes.
a Simulated and b experimental transmittance spectra for the NCRD, Py-DI and Au-RI structures. Dashed lines mark the major features in the spectra at 600, 820 and 1600 nm. The small black arrow in (a) highlights a minor feature due to the weak far-field diffractive coupling in a simulated periodic array of defect-less structures. c Surface charge density maps (see Materials and methods) for the Au-RI and NCRD structures at 600, 820 and 1600 nm, normalized to the map at 820 nm for the NCRD for direct comparison. The simulations in (c) were carried out using linearly polarized electromagnetic radiation, as indicated by the black arrow (Ei = 1 Vm−1). The surface charge density for the Au-RI at 820 nm was multiplied by a factor of 10 for visualization purposes

