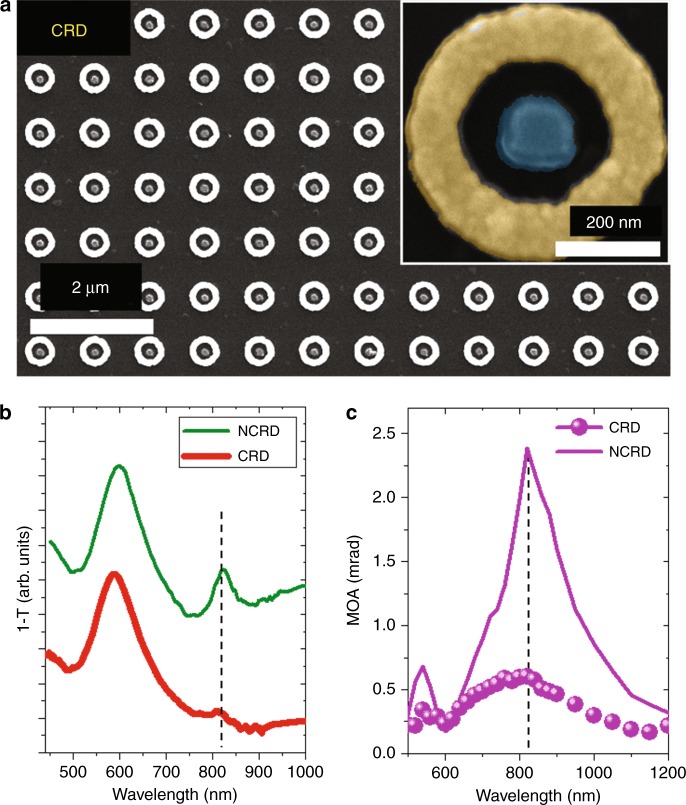
Fig. 6. SEM and MOKE of the CDR cavities.
a Scanning electron microscopy images of the array of CRD nanocavities. b Comparison between the experimental transmittance spectra for the CRD and NCRD nanocavities. c Comparison between the MOA experimental spectra for the CRD (solid symbols), NCRD (purple line), and Py-DI (gray line) structures. The noise level of the MO measurements is 2 μradians (standard deviation), namely, ~2 orders of magnitude smaller than the smallest signal measured in the experiments. Therefore, the error bars are far smaller than the size of the symbols and the line used in the plots of (c)

