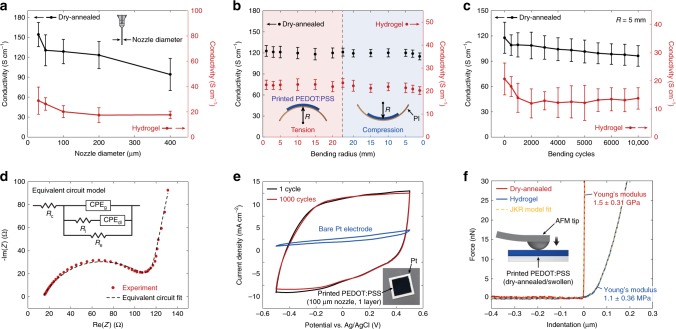
Fig. 3. Properties of 3D-printed conducting polymers.
a Conductivity as a function of nozzle diameter for 3D-printed conducting polymers in dry and hydrogel states. b Conductivity as a function of bending radius for 3D-printed conducting polymers in dry (17 µm, thickness) and hydrogel (78 µm, thickness) states. PI indicates polyimide. c Conductivity as a function of bending cycles for 3D-printed conducting polymers in dry (17 µm, thickness) and hydrogel (78 µm, thickness) states. d Nyquist plot obtained from the EIS characterization for a 3D-printed conducting polymer on Pt substrate (78 µm, thickness) overlaid with the plot predicted from the corresponding equivalent circuit model38. In the equivalent circuit models, Re represents electronic resistance, Ri represents ionic resistance, Rc represents the total ohmic resistance of the cell assembly, CPEdl represents the double-layer constant phase element (CPE), whereas CPEg represents the geometric CPE. CPE is used to account inhomogeneous or imperfect capacitance and are represented by the parameters Q and n where Q represents the peudocapacitance value and n represents the deviation from ideal capacitive behavior. The true capacitance C can be calculated from these parameters by using the relationship C = Qωmaxn−1, where ωmax is the frequency at which the imaginary component reaches a maximum37. The fitted values for 3D-printed PEDOT:PSS are Re = 107.1 Ω, Ri = 105.5 Ω, Rc = 14.07 Ω, Qdl = 1.467 × 10⁻⁵ F sn−1, ndl = 0.924, Qg = 4.446 × 10⁻⁷ F sn−1, and ndl = 0.647. e CV characterization for a 3D-printed conducting polymer on Pt substrate. f Nanoindentation characterizations for 3D-printed conducting polymers in dry and hydrogel states with the JKR model fits. Values in (a–c) represent the mean and the standard deviation (n = 5 per each testing conditions based on independently prepared samples and performed experiments).

