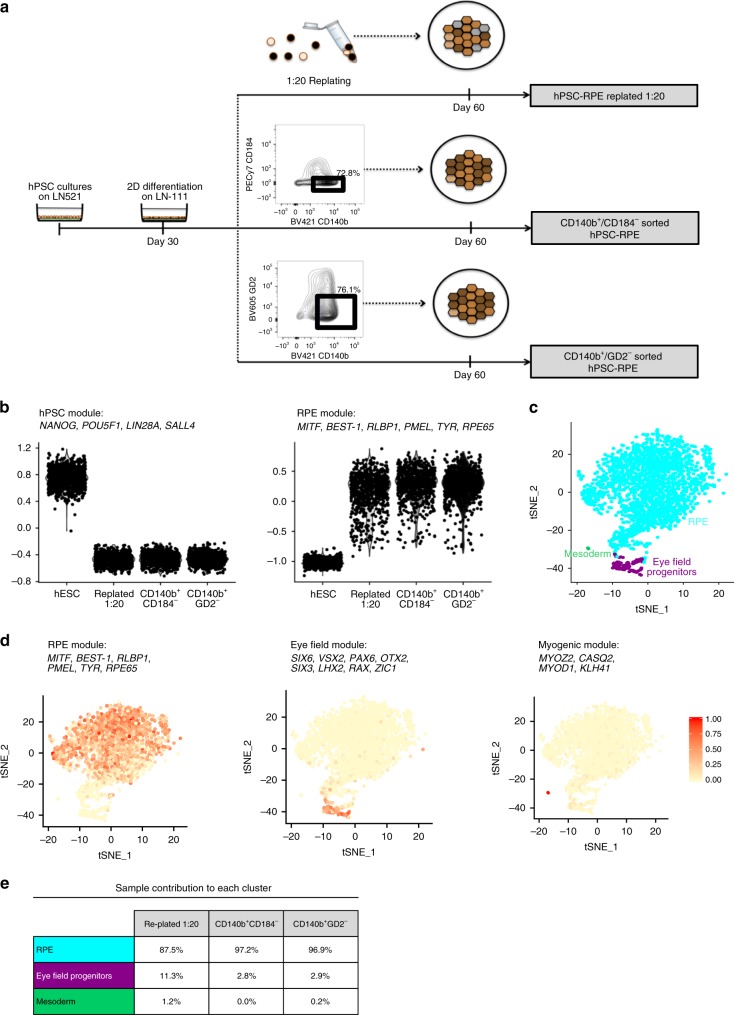
Fig. 4. Single-cell RNA-sequencing analysis following monolayer differentiation with and without cell surface marker enrichment.
a Schematics representing the differentiation routines for the FACS-sorted and replated hPSC-RPE cells that will be analyzed by 10x Genomics scRNA-seq. Included in the schematics, representative density plots illustrating the FACS sorting strategy followed to separate CD140b+/CD184− and CD140b+/GD2− cells at day 30 of hPSC-RPE differentiation. These sorted populations were subsequently seeded and cultured on hrLN-521 until day 60 of differentiation, when they were analyzed by 10x Genomics scRNA-seq. b Violin plots representing module expression scores for distinctive genes of hPSC (POU5F1, NANOG, LIN28A, and SALL4) and RPE cells (MITF, BEST-1, RLBP1, PMEL, TYR, RPE65). c tSNE representation of all cells showing cell lineage assignment of cells, using the 797 most variable genes across all cells. Cells are colored according to cluster and inferred cell type. d Feature plots displaying expression module scores over the tSNE plot for distinctive genes of RPE cells (MITF, BEST-1, RLBP1, PMEL, TYR, RPE65), eye-field (SIX6, VSX2, PAX6, OTX2, SIX3, LHX2, RAX, ZIC1), and myogenic lineage (MYOZ2, CASQ2, MYOD1, KLHL41). e Table representing percentage of contribution from each sample to each of the three clusters identified in c.

