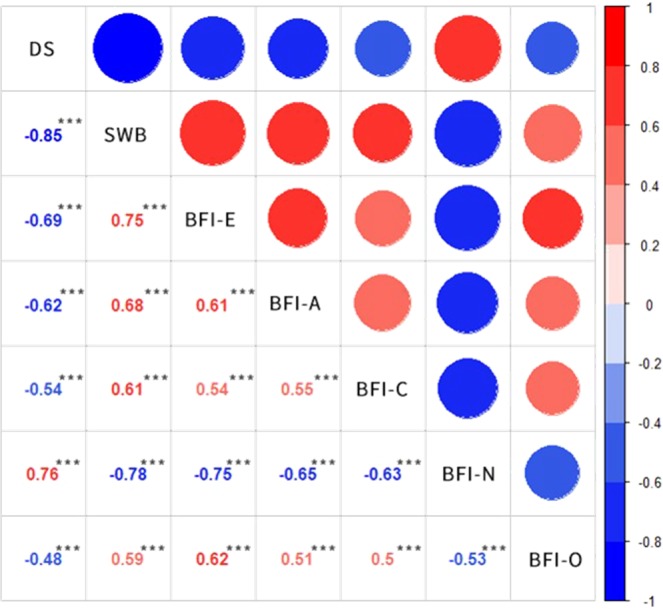
Figure 1.

Heat map illustrating correlations between personality traits and depressive symptoms and subjective well-being. The values in the lower triangular matrix is correlation coefficients. In the upper triangular matrix, big circles in dark colors indicates strong correlations. Positive correlations are showed in red while negative correlations are showed in blue. DS: depressive symptoms, SWB: Subjective well-being, BFI-E: Extraversion, BFI-A: Agreeableness, BFI-C: Conscientiousness, BFI-O: Openness to experience, BFI-N: Neuroticism. All correlation coefficients were significant at 0.001 level. *p < 0.05; **p < 0.01; ***p < 0.001.
