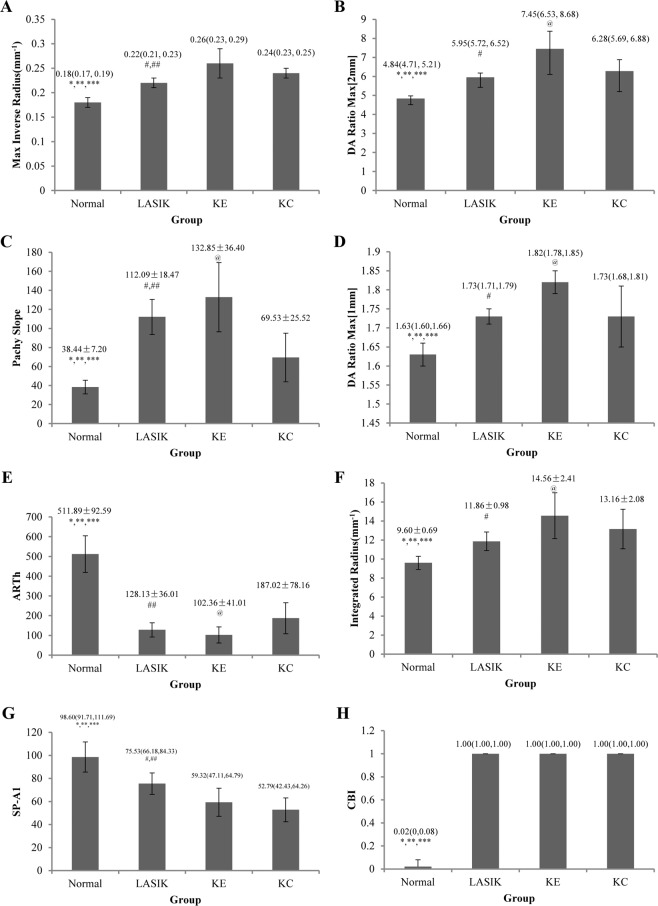
Figure 2.
The histogram analyses for new variables measured by Corvis ST (all P < 0.001 for general linear model. *P < 0.05 for Normal vs LASIK; **P < 0.05 for Normal vs KE; ***P < 0.05 for Normal vs KC; #P < 0.05 for LASIK vs KE; ##P < 0.05 for LASIK vs KC; @P < 0.05 for KE vs KC, Tukey-HSD method). (A) Max Inverse Radius; (B) DA Ratio Max [2 mm]; (C) Pachy Slope; (D) DA Ratio Max [1 mm]; (E) ARTh; (F) Integrated Radius; (G) SP-A1; (H) CBI.

