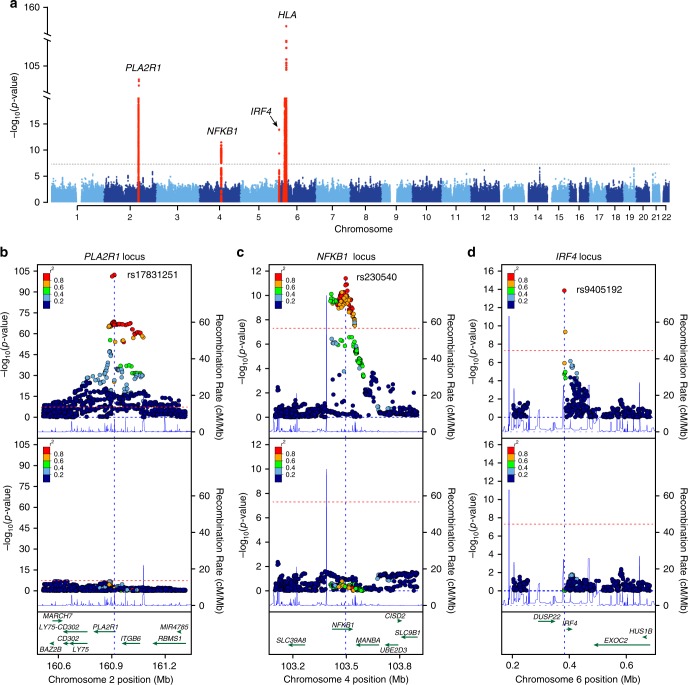
Fig. 1. Manhattan and regional plots for non-HLA loci for the combined meta-analysis of all MN cohorts.
a The results of the combined meta-analysis across all cohorts; the dotted horizontal line indicates a genome-wide significance threshold (α = 5 × 10⁻⁸); the y-axis is truncated twice to accommodate large peaks over PLA2R1 and HLA loci; genome-wide-significant loci highlighted in red; b Regional plot for the PLA2R1 locus; the upper panel shows unconditioned meta-results, the lower panel depicts meta-results after conditioning for the top SNP (rs17831251). c Regional plot for the NFKB1 locus; the upper panel corresponds to unconditioned results; the lower panel shows meta-results after controlling for rs230540. d Regional plot for the IRF4 locus; the upper panel corresponds to unconditioned results; the lower panel shows meta-results after controlling for rs9405192. The x-axis denotes genomic location (hg19 coordinates), left y-axis represents –log P values for association statistics, right y-axis represents average recombination rates based on HapMap-III reference populations combined (blue line). In the conditional analyses, we conditioned on the top SNP in each individual cohort, then meta-analyzed conditioned summary statistics as described in the Methods.

