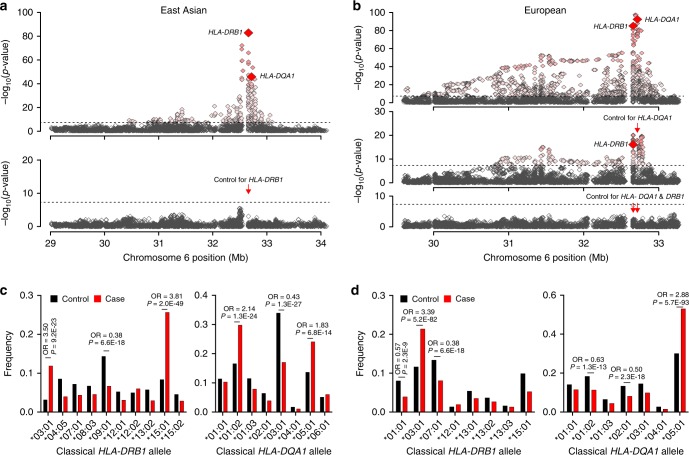
Fig. 2. Ethnicity-specific association analyses point to HLA-DRB1 and HLA-DQA1 as the top associated genes.
a Regional plot for East Asian cohorts that includes association statistics for all imputed variants and classical HLA alleles; the strongest association signal was for HLA-DRB1 gene (upper panel); the results for HLA-DQA1 gene are highlighted for reference; after adjusting for all DRB1 classical alleles (red arrow), there were no residual associations across the entire 3-Mb region (lower panel). The dotted horizontal line indicates the genome-wide significance threshold (α = 5 × 10⁻⁸). b In Europeans, the strongest HLA gene association was for the HLA-DQA1 gene (upper panel); after controlling for all classical DQA1 alleles (red arrow), HLA-DRB1 gene remained genome-wide significant (middle panel); after controlling for both DRB1 and DQA1, there were no significant associations in the region (lower panel), suggesting that variation in both genes explains the entire signal. c East Asian frequency distributions of classical DRB1 and DQA1 alleles (four-digit resolution) for cases (red) and controls (black); unadjusted ORs and P-values provided for genome-wide significant alleles. d The European frequency distributions of classical DRB1 and DQA1 alleles (four-digit resolution) for cases (red) and controls (black); unadjusted ORs and P-values provided for genome-wide significant alleles.

