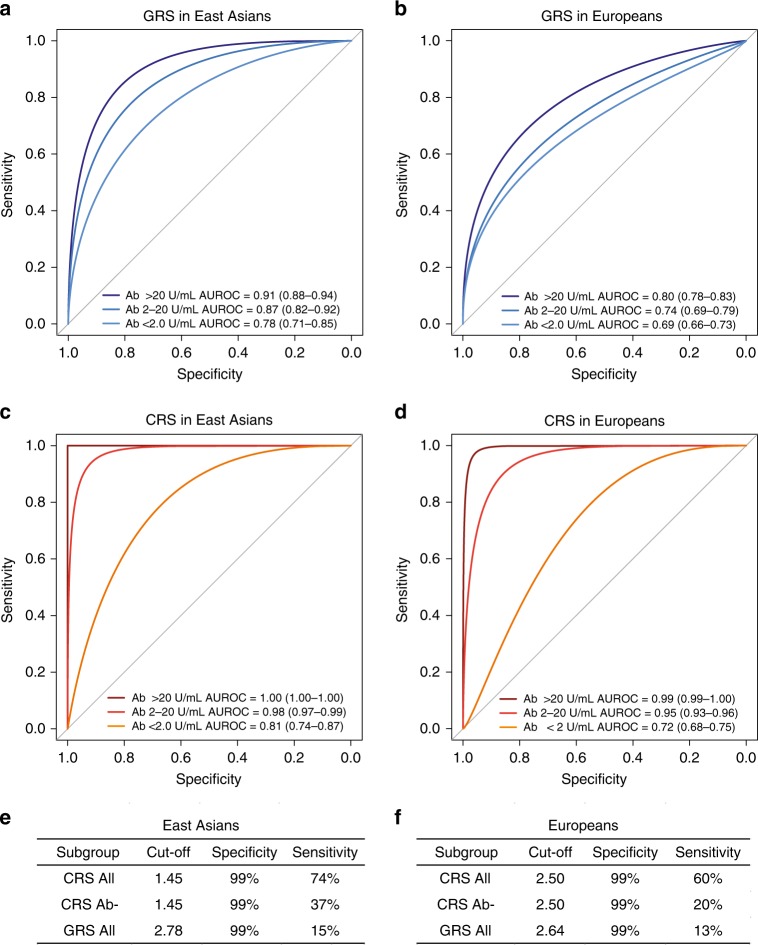
Fig. 7. Diagnostic properties of the genetic risk score (GRS) and combined risk score (CRS) stratified by anti-PLA2R antibody status.
Comparisons of receiver operating characteristic (ROC) curves to discriminate antibody positive (PLA2R Ab > 20 U/mL), borderline negative (PLA2R Ab 2–20 U/mL), and negative (PLA2R Ab < 2 U/mL) cases of primary MN from all available healthy and diseased controls combined for a GRS in East Asian discovery cohorts, b GRS in European discovery and validation cohorts, c CRS in East Asian discovery cohorts, d CRS in European discovery and validation cohorts. Overall sensitivities for risk score cut-offs corresponding to 99% specificities in (e) East Asian discovery cohorts and (f) European discovery and validation cohorts; CRS All: all patients with serum Ab measurements by ELISA within 6 months of a diagnostic kidney biopsy; CRS Ab-: patient subgroup with PLA2R Ab < 20 U/mL, and GRS All: all patients with GWAS data available for GRS calculation. AUROC: area under the ROC curve (95% confidence interval).

