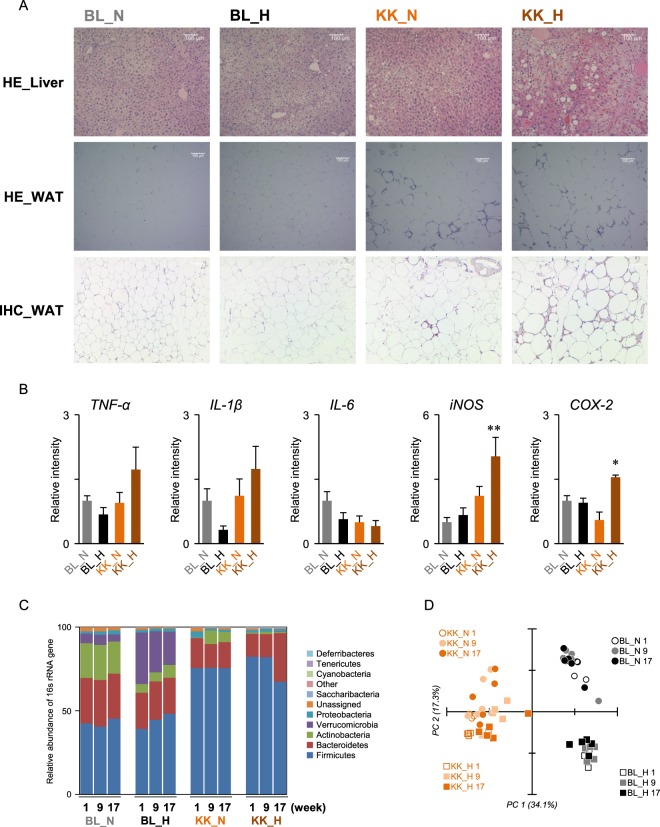
Figure 2.
Pathophysiological change in mice liver and feces. (A) HE staining and IHC of liver and WAT. Mouse livers and WAT collected at week 20 were prepared and stained with HE and IHC for F4/80. Representative images (scale bar = 100 µm) are shown. (B) Inflammatory gene expressions in mouse livers at week 20. RT-qPCR (n = 5–6 in each group) were performed as described in the Materials and Method. *p < 0.05, **p < 0.01 compared with the BL_N group by one-way ANOVA with post hoc test (Bonferroni). (C) Microbial composition in mouse feces collected at weeks 1, 9 and 17. 16 s rRNA sequencing was performed. Relative abundance and taxonomic classification at the phylum level were analyzed by QIIME. (D) PCA of microbial composition in mouse feces. Data were analyzed by QIIME.

