Figure 3.
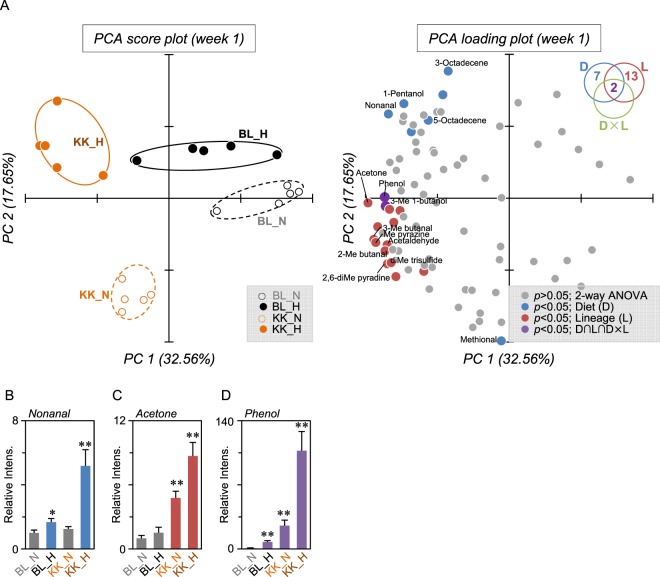
Fecal VOC profile in NFD- or HFD-fed C57BL/6J or KK-Ay mice. (A) PCA score plot and loading plot of fecal VOC analysis at week 1. The peak area values of the integrated 82 peaks obtained by GC-MS analyses were used as variables in PCA. The diagram in the upper right summarizes the quantity of significance (p < 0.05) by two-way ANOVA with multiple testing correction using the Bonferroni family-wise error rate. Compounds determined as significantly different by diet (D) and mouse lineage (L) are shown as blue and red dots, respectively. Two compounds, phenol and 3-methyl 1-butanol (purple dots), were determined as significant in D × L (interaction between L and D by two-way ANOVA) and in L and D (D ∩ L ∩ D × L). Other compound peaks not determined as significant are shown as gray dots. Ellipses drawn on PCA score plot do not reflect any statistical significance. Relative fecal levels of nonanal (B), acetone (C), and phenol (D) in C57BL/6 and KK-Ay mice fed a normal or high fat diet are summarized. Data are the means ± SEM (n = 5). Significant difference; *p < 0.05, **p < 0.01 compared with BL_N by one-way ANOVA with post hoc test (Bonferroni).

