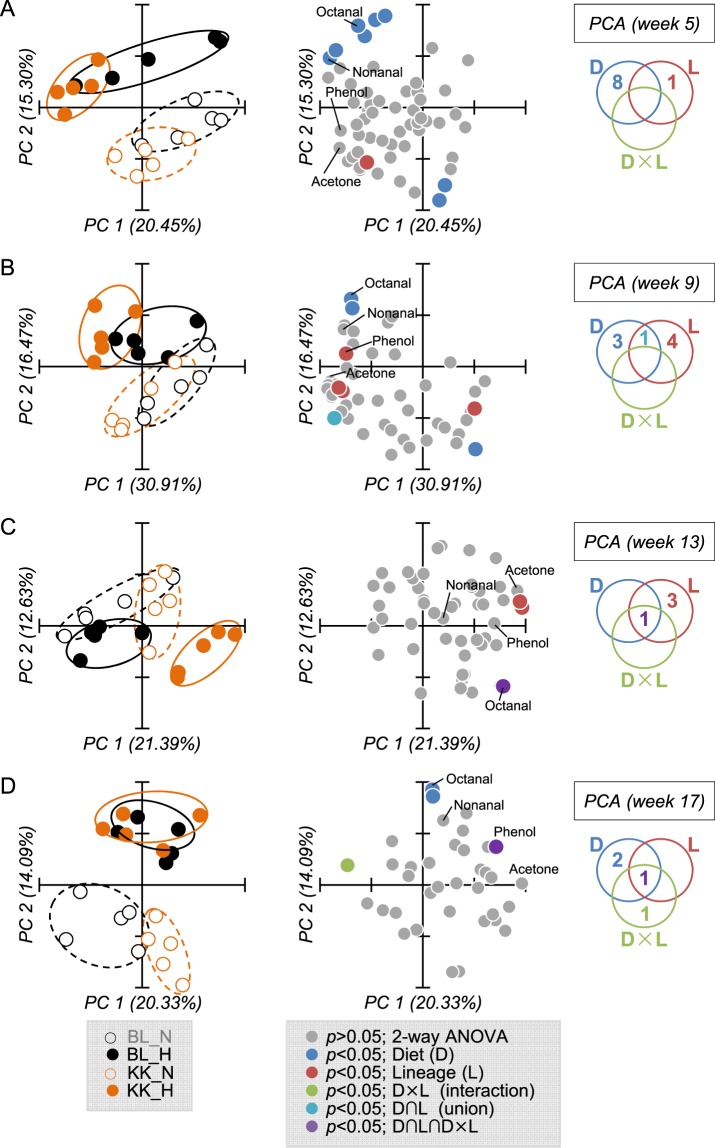
Figure 4.
Fecal VOC profile at weeks 5 (A), 9 (B), 13 (C), and 17 (D). Feces collected from C57BL/6 and KK-Ay mice fed with a normal or high fat diet were subjected to HSS-GC-MS, then the integrated peak area was used as a variable in PCA. Results show the score plot (left), loading plot (center), and a diagram (right) summarizing the significance (p < 0.05) by two-way ANOVA with multiple testing correction using the Bonferroni family-wise error rate. Ellipses drawn on PCA score plot do not reflect any statistical significance.

