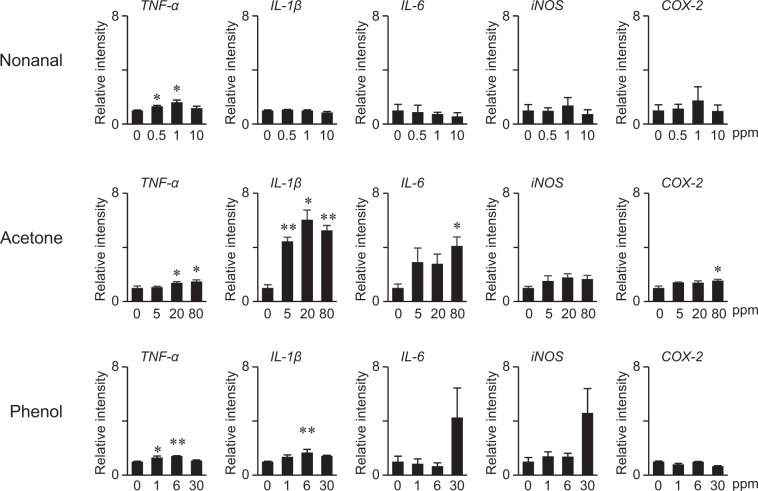
Figure 5.
RT-qPCR analysis for proinflammatory activities of VOCs in RAW264 cells. RAW264 cells were treated with nonanal, acetone, or phenol at the indicated concentrations for 6 hours. Relative gene expression levels were analyzed by qRT-PCR. Values are the mean ± SEM (n = 3). Statistical analyses were performed by one-way ANOVA followed by post hoc test (Bonferroni). Statistical significance was set as *p < 0.05, **p < 0.01 compared with controls (0 ppm).

