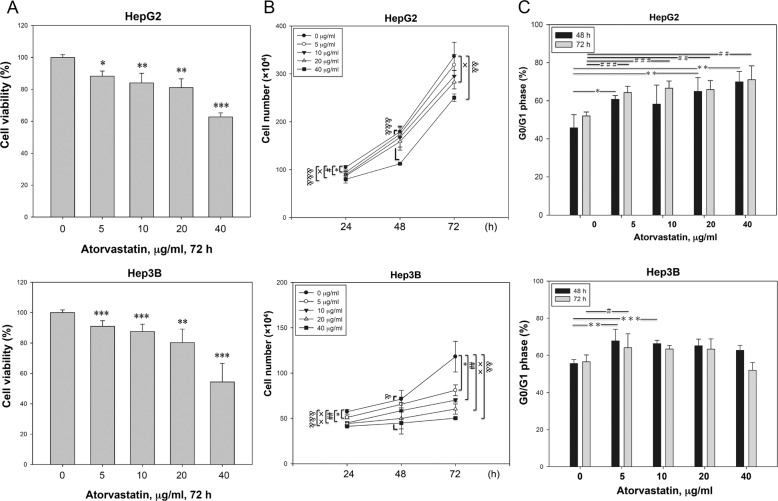
Fig. 1. Atorvastatin induced growth inhibition and G0/G1 phase arrest in HCC cells.
Atorvastatin suppressed the growth (a) and decreased the total numbers (b) of HepG2 and Hep3B cells. The data are presented as the percentages of vehicle-treated cells. c Atorvastatin induced G0/G1 arrest in HepG2 and Hep3B cells. Cells were treated with atorvastatin (0, 5, 10, 20, or 40 μg/ml) for 24, 48, or 72 h, and cell growth was then measured by the CCK-8 assay (a). Cell numbers were determined by counting viable cells (b), and cell cycle distributions were measured via flow cytometry (c). b The asterisk indicates a significant difference between control and 5 μg/ml; the pound sign indicate a significant difference between control and 10 μg/ml; the double dagger indicates a significant difference between control and 20 μg/ml; and the ampersand indicates a significant difference between control and 40 μg/ml. c The asterisk indicates a significant difference between untreated and treated for 48 h; the pound sign indicates a significant difference between untreated and treated for 72 h.

