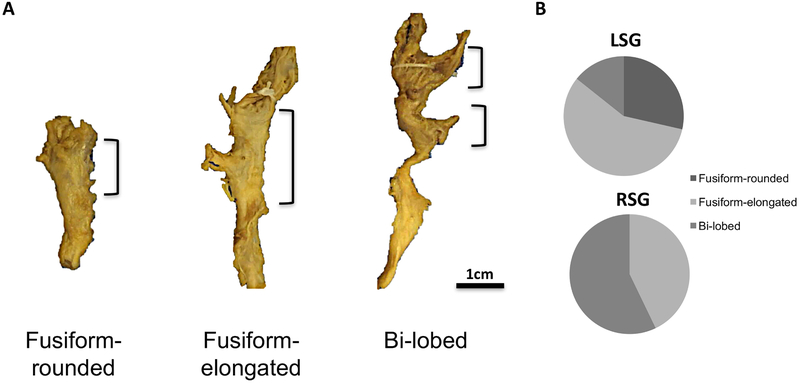
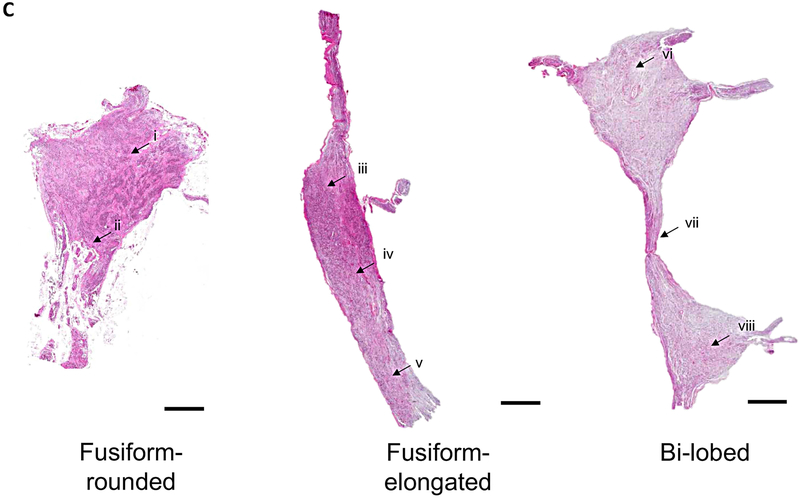
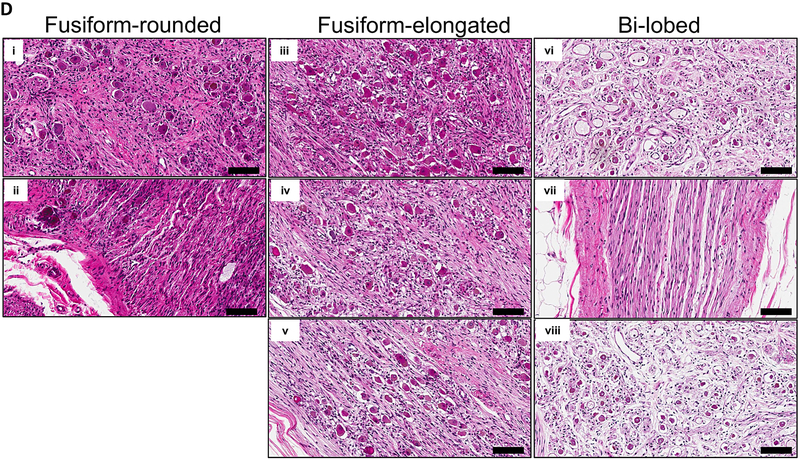
Figure 1. Morphological Characterization of Human Stellate Ganglia.
A. Representative images of the three major morphological groups of stellate (cervicothoracic)ganglia identified are shown. Scale bar: 1cm. B. Distribution of morphologies in left and right SG (LSG and RSG, respectively). C. Representative histologic sections showing the distribution of neurons within the morphologies of ganglia observed. D. Magnified image of neurons and axons from the regions shown in panel C. Scale bar: 100μm.


