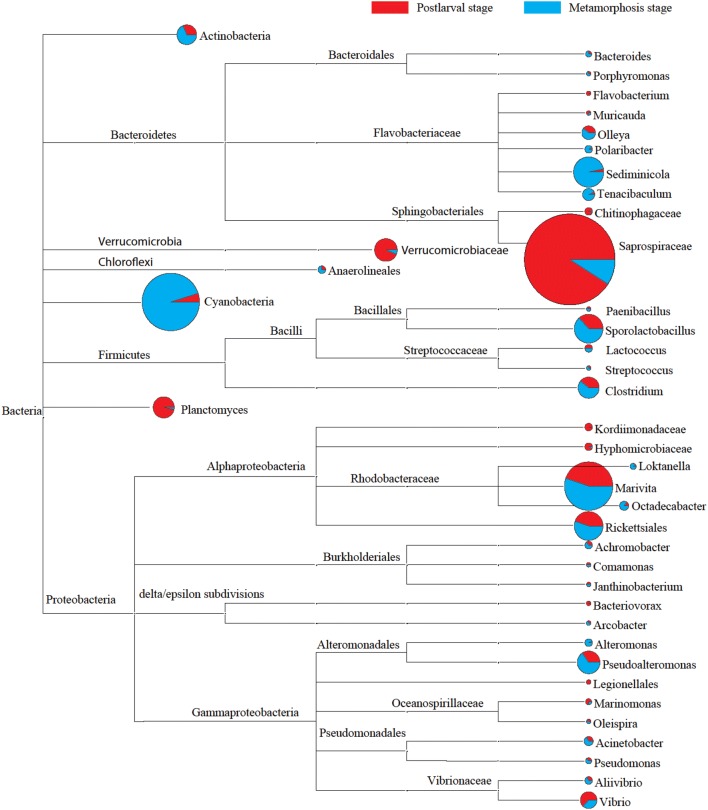
Fig. 2.
Comparison of the dominant bacterial populations at genus level in the aquaculture environment during the nursery phase of L. vannamei larvae. The OTUs without genus-level information were clustered based on the lowest taxon information. Pie charts reflect the relative abundance of each dominant operational taxonomic unit (OTU) (relative abundance > 1%) at two stages (blue represents the metamorphosis stage, Day 1 to Day 10; red represents the postlarval stage, Day 11 to Day 20); and the size of the pie chart reflects the total number of dominant OTUs in all samples

