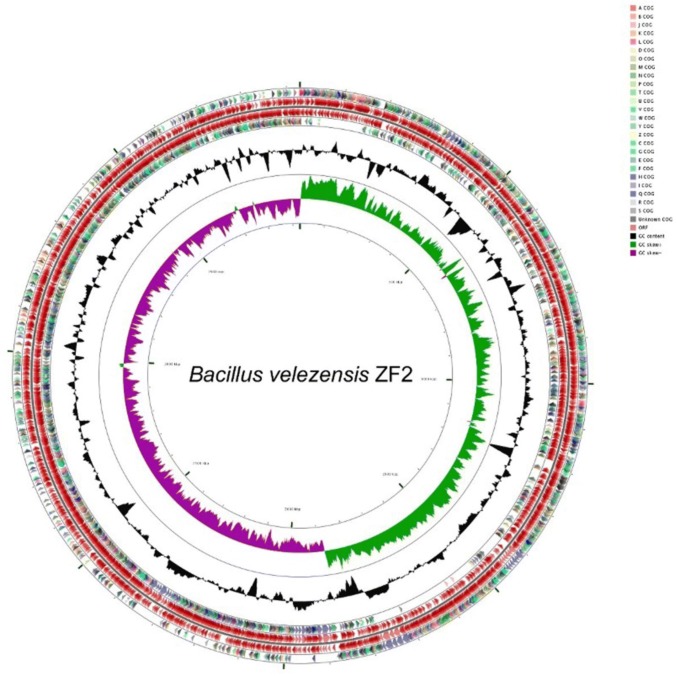
Fig. 1.
Graphical circular map of the B. velezensis ZF2 genome generated using the CGview server. From outside to center, rings 1 and 4 show protein-coding genes oriented in the forward (colored by COG categories) and reverse (colored by COG categories) directions, respectively. Rings 2 and 3 show genes on the forward and reverse strands. Ring 5 shows the G + C% content plot (black), and the inner most ring shows the GC skews, where green indicates positive values and purple indicates negative values

