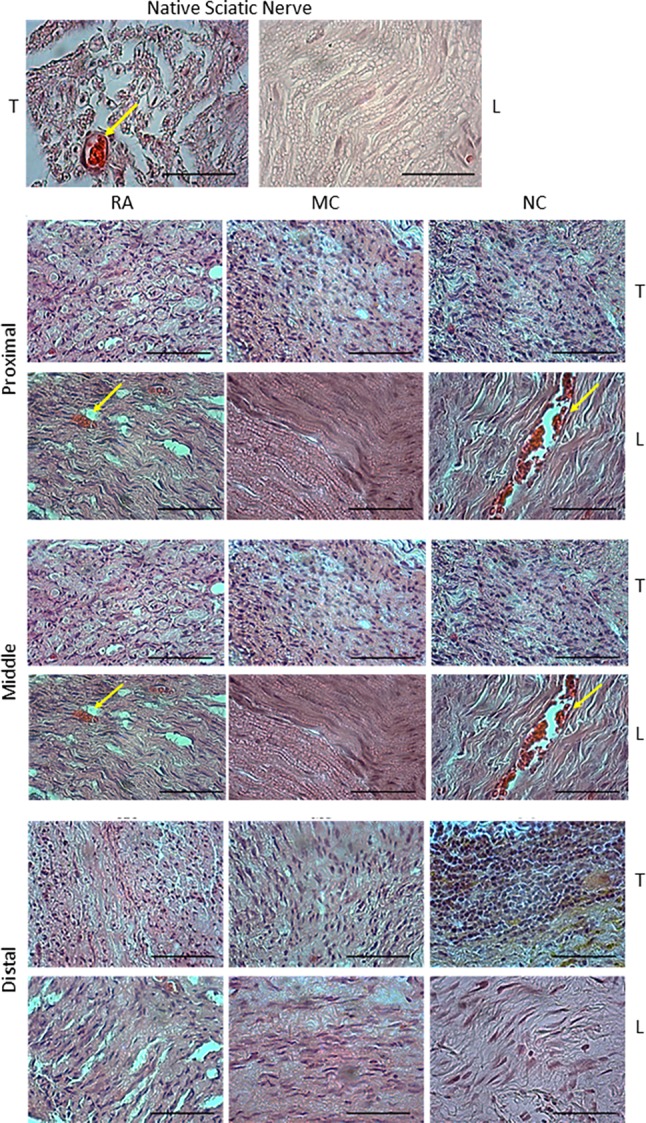
Fig. 3.

H & E staining of the harvested sciatic nerve for RA (n = 3), MC (n = 4) and NC (n = 4) groups (proximal, middle and distal). Arrows show red blood cells on the proximal part of RA and NC similar to those of the native sciatic nerve. Magnification, 20×. Scale bar, 100 μm. T = transverse section, L = longitudinal section
